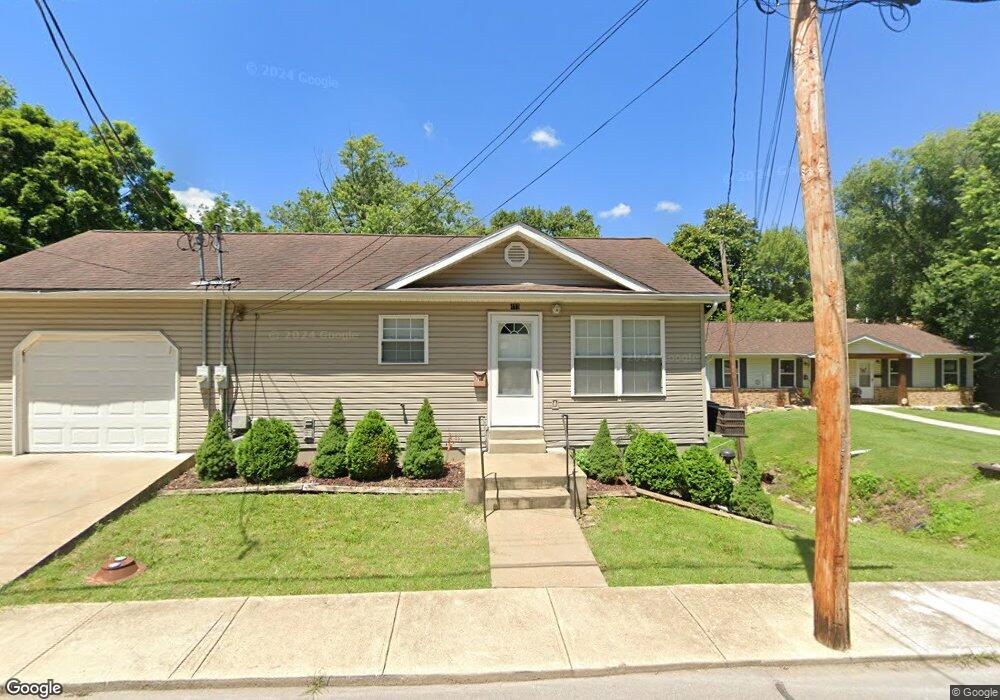
415 Moore St Festus, MO 63028
Festus/Crystal City NeighborhoodEstimated Value: $210,000 - $242,000
3
Beds
2
Baths
1,500
Sq Ft
$147/Sq Ft
Est. Value
About This Home
This home is located at 415 Moore St, Festus, MO 63028 and is currently estimated at $220,813, approximately $147 per square foot. 415 Moore St is a home located in Jefferson County with nearby schools including Festus Elementary School, Festus Intermediate School, and Festus Middle School.
Ownership History
Date
Name
Owned For
Owner Type
Purchase Details
Closed on
Dec 31, 2012
Sold by
Freiner Michael D and Freiner Jennifer
Bought by
Johnson Timothy S
Current Estimated Value
Home Financials for this Owner
Home Financials are based on the most recent Mortgage that was taken out on this home.
Original Mortgage
$116,239
Outstanding Balance
$80,366
Interest Rate
3.25%
Mortgage Type
FHA
Estimated Equity
$140,447
Purchase Details
Closed on
Feb 1, 2006
Sold by
Milbourn Betty J
Bought by
Freiner Michael D
Home Financials for this Owner
Home Financials are based on the most recent Mortgage that was taken out on this home.
Original Mortgage
$93,500
Interest Rate
6.24%
Mortgage Type
Fannie Mae Freddie Mac
Create a Home Valuation Report for This Property
The Home Valuation Report is an in-depth analysis detailing your home's value as well as a comparison with similar homes in the area
Home Values in the Area
Average Home Value in this Area
Purchase History
| Date | Buyer | Sale Price | Title Company |
|---|---|---|---|
| Johnson Timothy S | -- | Intergrity Land Title Co Inc | |
| Freiner Michael D | -- | Ust |
Source: Public Records
Mortgage History
| Date | Status | Borrower | Loan Amount |
|---|---|---|---|
| Open | Johnson Timothy S | $116,239 | |
| Previous Owner | Freiner Michael D | $93,500 |
Source: Public Records
Tax History
| Year | Tax Paid | Tax Assessment Tax Assessment Total Assessment is a certain percentage of the fair market value that is determined by local assessors to be the total taxable value of land and additions on the property. | Land | Improvement |
|---|---|---|---|---|
| 2025 | $912 | $17,400 | $1,500 | $15,900 |
| 2024 | $912 | $16,100 | $1,500 | $14,600 |
| 2023 | $912 | $16,100 | $1,500 | $14,600 |
| 2022 | $907 | $16,100 | $1,500 | $14,600 |
| 2021 | $907 | $16,100 | $1,500 | $14,600 |
| 2020 | $860 | $14,300 | $1,200 | $13,100 |
| 2019 | $859 | $14,300 | $1,200 | $13,100 |
| 2018 | $775 | $14,300 | $1,200 | $13,100 |
| 2017 | $775 | $14,300 | $1,200 | $13,100 |
| 2016 | $730 | $13,400 | $1,500 | $11,900 |
| 2015 | $726 | $13,400 | $1,500 | $11,900 |
| 2013 | -- | $12,800 | $1,500 | $11,300 |
Source: Public Records
Map
Nearby Homes
- 601 Warne St
- 212 N Adams St
- 416 Russell Ave
- 716 N Mill St
- 617 N 6th St
- 722 Delmar Ave
- 410 S 4th St
- 823 Delmar Ave
- 405 S 5th St
- 409 S 5th St
- 129 N 9th St
- 854 Delmar Ave
- 609 Valentine St
- 1016 Ann St
- 810 S 2nd St
- 407 Jefferson Ave
- 806 Virginia Ave
- 2533 U S Highway 67
- 000 U S Highway 67
- 912 Parc Central Dr
Your Personal Tour Guide
Ask me questions while you tour the home.