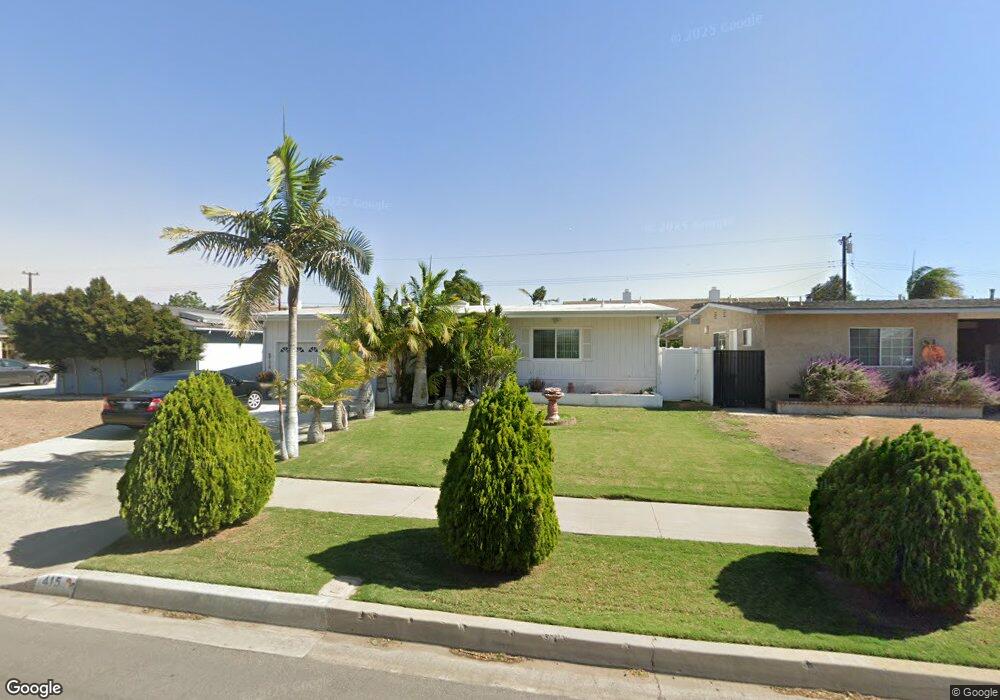
415 N Fern St Orange, CA 92867
Estimated Value: $960,000 - $1,116,000
4
Beds
2
Baths
1,457
Sq Ft
$718/Sq Ft
Est. Value
About This Home
This home is located at 415 N Fern St, Orange, CA 92867 and is currently estimated at $1,045,594, approximately $717 per square foot. 415 N Fern St is a home located in Orange County with nearby schools including Handy Elementary School, Yorba Middle School, and Orange High School.
Ownership History
Date
Name
Owned For
Owner Type
Purchase Details
Closed on
Oct 28, 2011
Sold by
Valencia Alberto and Valencia Martha Elsa
Bought by
Valencia Alberto and Valencia Martha
Current Estimated Value
Purchase Details
Closed on
Jan 3, 2000
Sold by
Irma Zavala and Irma Guadalupe
Bought by
Valencia Alberto and Valencia Martha Elsa
Home Financials for this Owner
Home Financials are based on the most recent Mortgage that was taken out on this home.
Original Mortgage
$167,100
Outstanding Balance
$52,613
Interest Rate
7.72%
Estimated Equity
$992,981
Purchase Details
Closed on
Feb 12, 1997
Sold by
Philip Roberts and Philip Roberta Roberts
Bought by
Zavala Irma P and Martinez Guadalupe
Home Financials for this Owner
Home Financials are based on the most recent Mortgage that was taken out on this home.
Original Mortgage
$163,753
Interest Rate
7.86%
Mortgage Type
FHA
Create a Home Valuation Report for This Property
The Home Valuation Report is an in-depth analysis detailing your home's value as well as a comparison with similar homes in the area
Home Values in the Area
Average Home Value in this Area
Purchase History
| Date | Buyer | Sale Price | Title Company |
|---|---|---|---|
| Valencia Alberto | -- | None Available | |
| Valencia Alberto | -- | First American Title | |
| Zavala Irma P | $167,500 | Landwood Title Company |
Source: Public Records
Mortgage History
| Date | Status | Borrower | Loan Amount |
|---|---|---|---|
| Open | Valencia Alberto | $167,100 | |
| Closed | Zavala Irma P | $163,753 |
Source: Public Records
Tax History Compared to Growth
Tax History
| Year | Tax Paid | Tax Assessment Tax Assessment Total Assessment is a certain percentage of the fair market value that is determined by local assessors to be the total taxable value of land and additions on the property. | Land | Improvement |
|---|---|---|---|---|
| 2025 | $3,982 | $353,494 | $271,728 | $81,766 |
| 2024 | $3,982 | $346,563 | $266,400 | $80,163 |
| 2023 | $3,891 | $339,768 | $261,176 | $78,592 |
| 2022 | $3,812 | $333,106 | $256,055 | $77,051 |
| 2021 | $3,707 | $326,575 | $251,034 | $75,541 |
| 2020 | $3,672 | $323,227 | $248,460 | $74,767 |
| 2019 | $3,627 | $316,890 | $243,589 | $73,301 |
| 2018 | $3,571 | $310,677 | $238,813 | $71,864 |
| 2017 | $3,426 | $304,586 | $234,131 | $70,455 |
| 2016 | $3,360 | $298,614 | $229,540 | $69,074 |
| 2015 | $3,309 | $294,129 | $226,092 | $68,037 |
| 2014 | $3,238 | $288,368 | $221,663 | $66,705 |
Source: Public Records
Map
Nearby Homes
- 2705 E Orange Grove Ave
- 2515 E Orange Grove Ave
- 3145 E Scotts View Unit A
- 2929 E Hamilton Ave
- 641 N Milford St
- 234 N Milford St
- 692 N Adele St Unit 30
- 692 N Adele St Unit 103
- 692 N Adele St Unit 109
- 3318 E Chardonnay Ln Unit B
- 415 N Wayfield St
- 448 N Londonderry Ln Unit D
- 790 N Fern St
- 129 S Kathleen Ln
- 1904 E Palm Ave
- 811 N Handy St
- 3421 E Salisbury Cir Unit A
- 3518 E Berkshire Ct Unit D
- 3509 E Berkshire Ct Unit C
- 659 N Oxford Ct