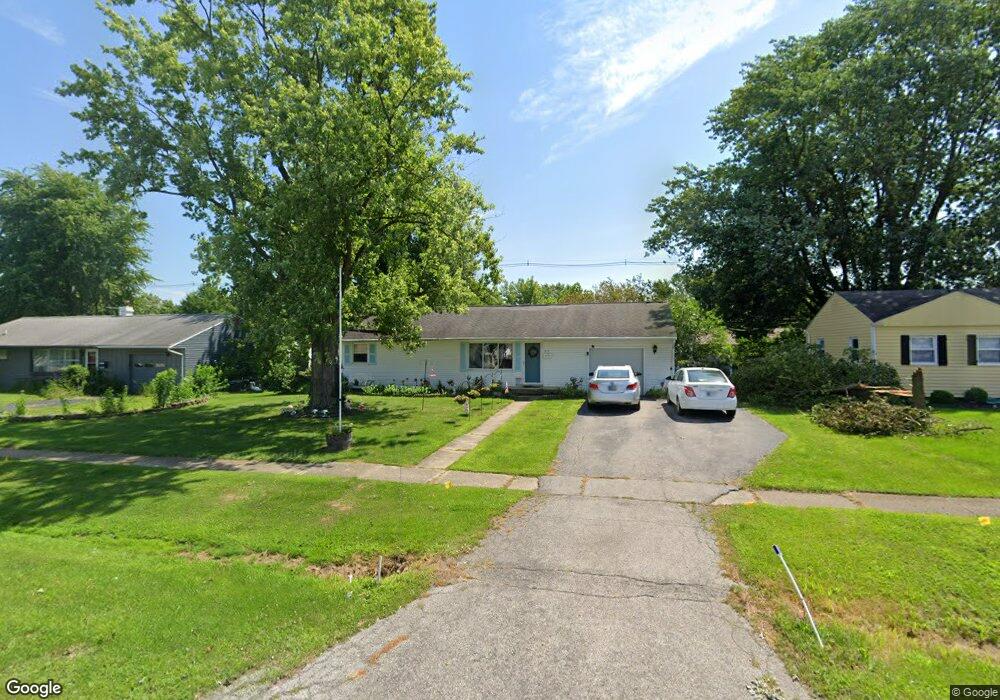
415 N Grant St Lebanon, IN 46052
Estimated Value: $188,000 - $214,000
3
Beds
1
Bath
1,960
Sq Ft
$102/Sq Ft
Est. Value
About This Home
This home is located at 415 N Grant St, Lebanon, IN 46052 and is currently estimated at $199,994, approximately $102 per square foot. 415 N Grant St is a home located in Boone County with nearby schools including Central Elementary School, Lebanon Middle School, and Lebanon Senior High School.
Ownership History
Date
Name
Owned For
Owner Type
Purchase Details
Closed on
Jun 3, 2019
Sold by
Est Grow Kimberly Allen and Est Joshua T Grow
Bought by
Grow Ruth R
Current Estimated Value
Purchase Details
Closed on
Jun 19, 2008
Sold by
American Home Mortgage Servicing Inc
Bought by
Grow Kim
Home Financials for this Owner
Home Financials are based on the most recent Mortgage that was taken out on this home.
Original Mortgage
$60,000
Outstanding Balance
$38,941
Interest Rate
6.36%
Mortgage Type
New Conventional
Estimated Equity
$161,053
Purchase Details
Closed on
Feb 7, 2008
Sold by
Michaels Michelle R
Bought by
American Home Mortgage Servicing Inc
Purchase Details
Closed on
Mar 10, 2005
Sold by
Stathers Sue and Stathers Sheila K
Bought by
Michaels Michelle R
Home Financials for this Owner
Home Financials are based on the most recent Mortgage that was taken out on this home.
Original Mortgage
$18,500
Interest Rate
5.7%
Mortgage Type
Stand Alone Second
Create a Home Valuation Report for This Property
The Home Valuation Report is an in-depth analysis detailing your home's value as well as a comparison with similar homes in the area
Home Values in the Area
Average Home Value in this Area
Purchase History
| Date | Buyer | Sale Price | Title Company |
|---|---|---|---|
| Grow Ruth R | -- | None Available | |
| Grow Kim | -- | -- | |
| American Home Mortgage Servicing Inc | -- | -- | |
| Michaels Michelle R | -- | -- |
Source: Public Records
Mortgage History
| Date | Status | Borrower | Loan Amount |
|---|---|---|---|
| Open | Grow Kim | $60,000 | |
| Previous Owner | Michaels Michelle R | $18,500 |
Source: Public Records
Tax History Compared to Growth
Tax History
| Year | Tax Paid | Tax Assessment Tax Assessment Total Assessment is a certain percentage of the fair market value that is determined by local assessors to be the total taxable value of land and additions on the property. | Land | Improvement |
|---|---|---|---|---|
| 2025 | $1,420 | $169,500 | $16,700 | $152,800 |
| 2024 | $1,420 | $158,300 | $16,700 | $141,600 |
| 2023 | $1,258 | $149,400 | $16,700 | $132,700 |
| 2022 | $1,209 | $135,200 | $16,700 | $118,500 |
| 2021 | $1,065 | $120,900 | $16,700 | $104,200 |
| 2020 | $948 | $112,500 | $16,700 | $95,800 |
| 2019 | $871 | $109,700 | $16,700 | $93,000 |
| 2018 | $859 | $104,700 | $16,700 | $88,000 |
| 2017 | $726 | $96,200 | $16,700 | $79,500 |
| 2016 | $653 | $93,500 | $16,700 | $76,800 |
| 2014 | $520 | $84,600 | $16,700 | $67,900 |
| 2013 | $473 | $82,600 | $16,700 | $65,900 |
Source: Public Records
Map
Nearby Homes
- 402 Glendale Dr
- 425 Atlas Dr
- 1000 Deodar St
- 330 Atlas Dr
- Cumberland Plan at Cedar Ridge - Maple Street Collection
- Yosemite Plan at Cedar Ridge - Maple Street Collection
- Beacon Plan at Cedar Ridge - Maple Street Collection
- Greenbriar Plan at Cedar Ridge - Maple Street Collection
- DaVinci Plan at Cedar Ridge - Maple Street Collection
- Fairfax Plan at Cedar Ridge - Maple Street Collection
- Jensen Plan at Cedar Ridge - Maple Street Collection
- Wesley Plan at Cedar Ridge - Maple Street Collection
- Breckenridge Plan at Cedar Ridge - Maple Street Collection
- 1002 Deodar St
- 514 E Washington St
- 507 N Park St
- 407 N Park St
- 307 N Park St
- 305 E Howard St
- 422 E Main St
- 415 N Grant St Unit center
- 407 N Grant St
- 423 N Grant St
- 414 Glendale Dr
- 408 Glendale Dr
- 422 Glendale Dr
- 420 N Grant St
- 426 N Grant St
- 416 N Grant St
- 401 N Grant St
- 502 Glendale Dr
- 514 N Grant St
- 516 N Grant St
- 412 N Grant St
- 406 N Grant St
- 507 N Grant St
- 508 Glendale Dr
- 415 Glendale Dr
- 421 Glendale Dr