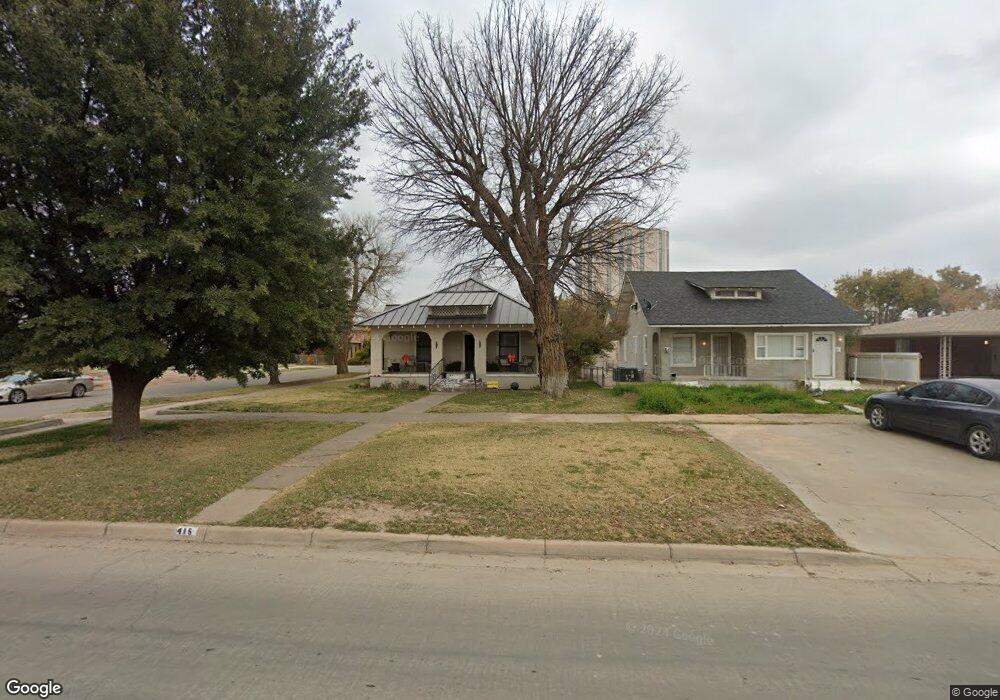
415 N Lea Ave Roswell, NM 88201
Estimated Value: $60,000 - $199,000
3
Beds
1
Bath
1,356
Sq Ft
$111/Sq Ft
Est. Value
About This Home
This home is located at 415 N Lea Ave, Roswell, NM 88201 and is currently estimated at $150,795, approximately $111 per square foot. 415 N Lea Ave is a home located in Chaves County with nearby schools including Washington Avenue Elementary School, Sierra Middle School, and Goddard High School.
Ownership History
Date
Name
Owned For
Owner Type
Purchase Details
Closed on
Jun 20, 2024
Sold by
Lewis Kerry J
Bought by
Lewis Kerry J and Arnold Cristina A
Current Estimated Value
Home Financials for this Owner
Home Financials are based on the most recent Mortgage that was taken out on this home.
Original Mortgage
$162,000
Outstanding Balance
$159,901
Interest Rate
6.94%
Mortgage Type
New Conventional
Estimated Equity
-$9,106
Purchase Details
Closed on
Nov 28, 2016
Sold by
Brown Richard
Bought by
Brown Trina
Purchase Details
Closed on
May 6, 2010
Sold by
Robinson Earl
Bought by
Brown Richard and Brown Trina
Home Financials for this Owner
Home Financials are based on the most recent Mortgage that was taken out on this home.
Original Mortgage
$26,000
Interest Rate
4.93%
Mortgage Type
Seller Take Back
Purchase Details
Closed on
Aug 1, 2008
Sold by
Rumbaugh Rebecca L
Bought by
Robinson Earl
Create a Home Valuation Report for This Property
The Home Valuation Report is an in-depth analysis detailing your home's value as well as a comparison with similar homes in the area
Home Values in the Area
Average Home Value in this Area
Purchase History
| Date | Buyer | Sale Price | Title Company |
|---|---|---|---|
| Lewis Kerry J | -- | None Listed On Document | |
| Brown Trina | -- | None Available | |
| Brown Richard | -- | Lawyers Title | |
| Robinson Earl | -- | None Available |
Source: Public Records
Mortgage History
| Date | Status | Borrower | Loan Amount |
|---|---|---|---|
| Open | Lewis Kerry J | $162,000 | |
| Previous Owner | Brown Richard | $26,000 |
Source: Public Records
Tax History Compared to Growth
Tax History
| Year | Tax Paid | Tax Assessment Tax Assessment Total Assessment is a certain percentage of the fair market value that is determined by local assessors to be the total taxable value of land and additions on the property. | Land | Improvement |
|---|---|---|---|---|
| 2025 | $1,108 | $41,974 | $5,000 | $36,974 |
| 2024 | $1,108 | $40,752 | $5,000 | $35,752 |
| 2023 | $1,111 | $39,565 | $5,000 | $34,565 |
| 2022 | $1,068 | $38,413 | $5,000 | $33,413 |
| 2021 | $1,060 | $37,294 | $5,000 | $32,294 |
| 2020 | $1,029 | $36,208 | $5,000 | $31,208 |
| 2019 | $1,000 | $35,233 | $5,000 | $30,233 |
| 2018 | $997 | $35,175 | $5,000 | $30,175 |
| 2017 | $668 | $23,807 | $5,000 | $18,807 |
| 2016 | $674 | $24,244 | $4,705 | $19,539 |
| 2015 | $720 | $23,538 | $4,130 | $19,408 |
| 2014 | $1,398 | $22,853 | $3,698 | $19,155 |
Source: Public Records
Map
Nearby Homes
- 601 N Kentucky Ave
- 414 N Missouri Ave
- 411 W 7th St
- 612 N Missouri Ave
- 703 W 5th St
- 806 N Pennsylvania Ave
- 7 Riverside Dr
- 804 N Washington Ave
- 620 N Main St
- 000 W Country Club & Sycamore
- 911 N Kentucky Ave
- 108 S Washington Ave
- 1007 W 3rd St
- 110 S Kansas Ave
- 205 S Kansas Ave
- 103 N Delaware Ave
- 712 W 12th St
- 407 E 5th St
- 1201 W 3rd St
- 212 W 13th St
- 411 N Lea Ave Unit A
- 406 W 5th St
- 501 N Lea Ave
- 409 N Lea Ave
- 407 W 5th St
- 405 N Lea Ave
- 412 N Kentucky Ave
- 505 N Lea Ave
- 414 N Lea Ave
- 412 N Lea Ave
- 500 N Kentucky Ave
- 507 N Lea Ave
- 500 N Lea Ave
- 406 N Kentucky Ave
- 406 N Lea Ave
- 401 N Lea Ave
- 509 N Lea Ave
- 504 N Lea Ave
- 506 N Kentucky Ave
- 404 N Lea Ave