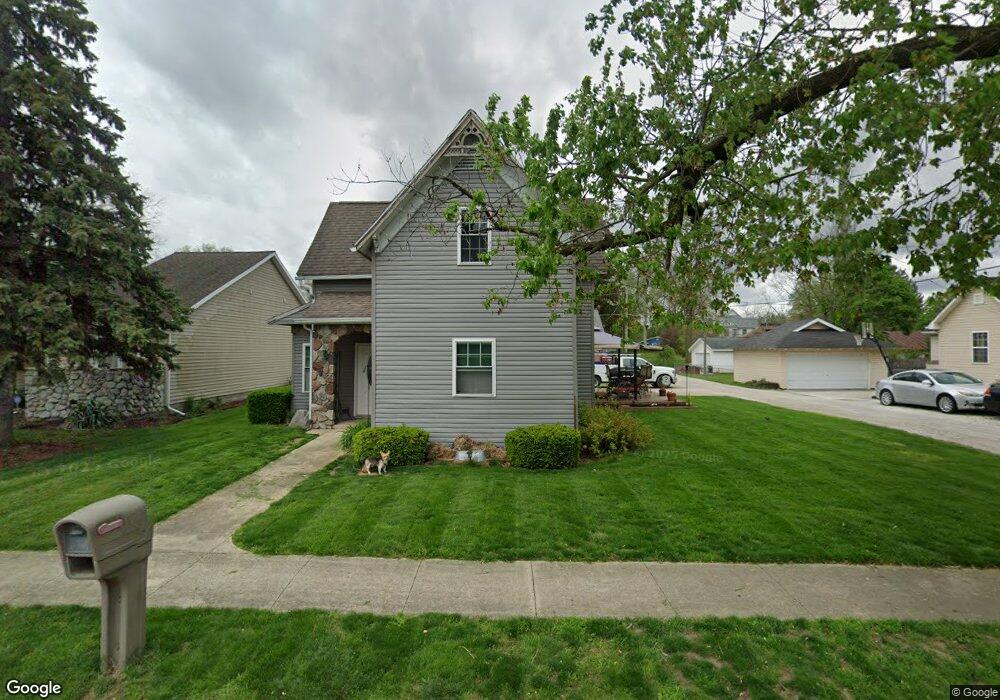
415 N Sycamore St Fairmount, IN 46928
Estimated Value: $136,000 - $144,000
3
Beds
1
Bath
1,513
Sq Ft
$93/Sq Ft
Est. Value
About This Home
This home is located at 415 N Sycamore St, Fairmount, IN 46928 and is currently estimated at $140,927, approximately $93 per square foot. 415 N Sycamore St is a home located in Grant County with nearby schools including Madison-Grant Junior/Senior High School.
Ownership History
Date
Name
Owned For
Owner Type
Purchase Details
Closed on
Oct 15, 2010
Sold by
Pdc Inc
Bought by
Powell Shawn A and Powell Amber
Current Estimated Value
Home Financials for this Owner
Home Financials are based on the most recent Mortgage that was taken out on this home.
Original Mortgage
$31,365
Outstanding Balance
$20,236
Interest Rate
4.3%
Mortgage Type
Future Advance Clause Open End Mortgage
Estimated Equity
$120,691
Purchase Details
Closed on
Sep 14, 2001
Sold by
Not Provided
Bought by
Not Provided
Purchase Details
Closed on
Jan 30, 2001
Sold by
Not Provided
Bought by
Not Provided
Create a Home Valuation Report for This Property
The Home Valuation Report is an in-depth analysis detailing your home's value as well as a comparison with similar homes in the area
Home Values in the Area
Average Home Value in this Area
Purchase History
| Date | Buyer | Sale Price | Title Company |
|---|---|---|---|
| Powell Shawn A | -- | None Available | |
| Not Provided | $22,500 | -- | |
| Not Provided | -- | -- |
Source: Public Records
Mortgage History
| Date | Status | Borrower | Loan Amount |
|---|---|---|---|
| Open | Powell Shawn A | $31,365 |
Source: Public Records
Tax History
| Year | Tax Paid | Tax Assessment Tax Assessment Total Assessment is a certain percentage of the fair market value that is determined by local assessors to be the total taxable value of land and additions on the property. | Land | Improvement |
|---|---|---|---|---|
| 2025 | $790 | $121,800 | $11,600 | $110,200 |
| 2024 | $790 | $111,900 | $11,600 | $100,300 |
| 2023 | $550 | $90,600 | $11,600 | $79,000 |
| 2022 | $475 | $82,000 | $10,300 | $71,700 |
| 2021 | $367 | $71,000 | $10,300 | $60,700 |
| 2020 | $307 | $68,500 | $10,300 | $58,200 |
| 2019 | $305 | $68,100 | $10,300 | $57,800 |
| 2018 | $309 | $65,700 | $9,800 | $55,900 |
| 2017 | $285 | $64,100 | $9,800 | $54,300 |
| 2016 | $240 | $62,200 | $9,800 | $52,400 |
| 2014 | $212 | $58,200 | $9,800 | $48,400 |
| 2013 | $212 | $56,400 | $9,800 | $46,600 |
Source: Public Records
Map
Nearby Homes
- 409 N Sycamore St
- 421 N Sycamore St
- 403 N Sycamore St
- 207 E Third St
- 418 N Main St
- 420 N Main St
- 414 N Sycamore St
- 404 N Sycamore St
- 416 N Sycamore St
- 424 N Sycamore St
- 320 N Sycamore St
- 501 N Sycamore St
- 406 N Main St
- 504 N Main St
- 410 N Main St
- 316 N Sycamore St
- 409 N Vine St
- 509 N Sycamore St
- 403 N Vine St
- 512 N Main St
Your Personal Tour Guide
Ask me questions while you tour the home.