Estimated Value: $141,000 - $158,000
3
Beds
2
Baths
1,386
Sq Ft
$109/Sq Ft
Est. Value
About This Home
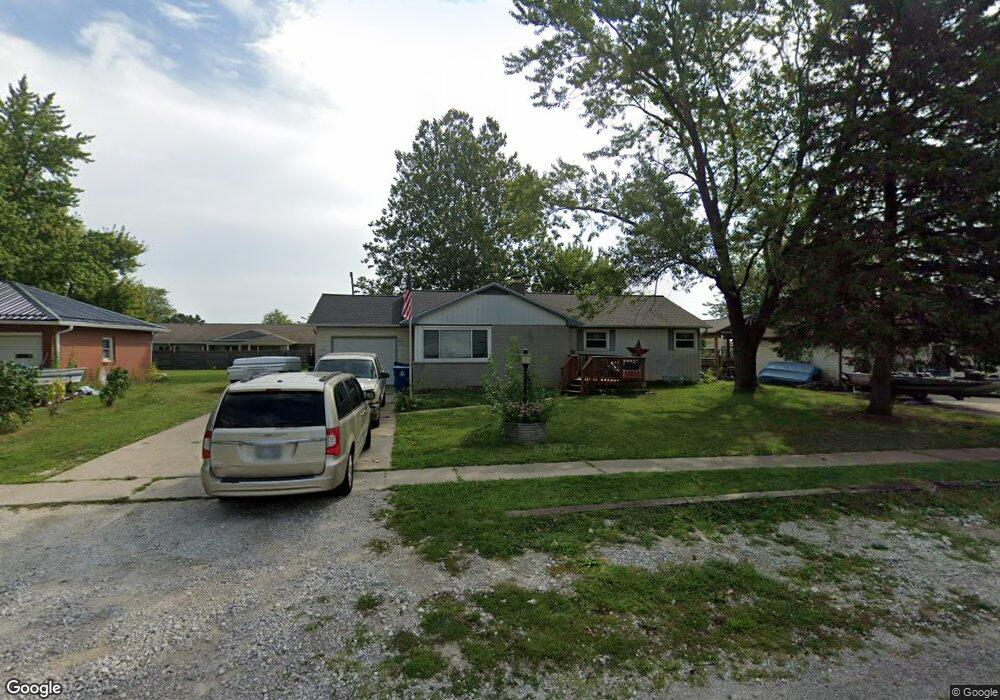
This home is located at 415 Olive Dr, Bryan, OH 43506 and is currently estimated at $150,791, approximately $108 per square foot. 415 Olive Dr is a home located in Williams County with nearby schools including Bryan Elementary PK-5, Washington Elementary School, and Bryan Middle School/High School.
Ownership History
Date
Name
Owned For
Owner Type
Purchase Details
Closed on
Mar 25, 2021
Sold by
Whaley Ronald L and Whaley Anita A
Bought by
Robbins John and Robbins Jason
Current Estimated Value
Home Financials for this Owner
Home Financials are based on the most recent Mortgage that was taken out on this home.
Original Mortgage
$81,395
Interest Rate
3%
Mortgage Type
FHA
Purchase Details
Closed on
Mar 14, 2018
Sold by
Whaley Ronald L and Anita Whaley A
Bought by
Robbins John and Robbins Jason
Home Financials for this Owner
Home Financials are based on the most recent Mortgage that was taken out on this home.
Original Mortgage
$78,000
Interest Rate
5%
Mortgage Type
Land Contract Argmt. Of Sale
Purchase Details
Closed on
Dec 30, 1991
Bought by
Whaley Ronald L And
Create a Home Valuation Report for This Property
The Home Valuation Report is an in-depth analysis detailing your home's value as well as a comparison with similar homes in the area
Home Values in the Area
Average Home Value in this Area
Purchase History
| Date | Buyer | Sale Price | Title Company |
|---|---|---|---|
| Robbins John | $98,000 | Title Solutions Group Llc | |
| Robbins John | -- | None Listed On Document | |
| Robbins John | $98,000 | None Available | |
| Whaley Ronald L And | $55,500 | -- |
Source: Public Records
Mortgage History
| Date | Status | Borrower | Loan Amount |
|---|---|---|---|
| Previous Owner | Robbins John | $81,395 | |
| Previous Owner | Robbins John | $78,000 |
Source: Public Records
Tax History
| Year | Tax Paid | Tax Assessment Tax Assessment Total Assessment is a certain percentage of the fair market value that is determined by local assessors to be the total taxable value of land and additions on the property. | Land | Improvement |
|---|---|---|---|---|
| 2025 | $1,838 | $41,760 | $6,020 | $35,740 |
| 2024 | $1,838 | $41,760 | $6,020 | $35,740 |
| 2023 | $1,856 | $32,310 | $6,830 | $25,480 |
| 2022 | $1,592 | $32,310 | $6,830 | $25,480 |
| 2021 | $1,628 | $32,310 | $6,830 | $25,480 |
| 2020 | $1,412 | $27,160 | $5,740 | $21,420 |
| 2019 | $1,401 | $27,160 | $5,740 | $21,420 |
| 2018 | $699 | $27,160 | $5,740 | $21,420 |
| 2017 | $1,353 | $26,110 | $5,740 | $20,370 |
| 2016 | $1,294 | $26,110 | $5,740 | $20,370 |
| 2015 | $1,347 | $26,110 | $5,740 | $20,370 |
| 2014 | $1,347 | $26,110 | $5,740 | $20,370 |
| 2013 | $1,352 | $26,110 | $5,740 | $20,370 |
Source: Public Records
Map
Nearby Homes
- 404 E Wilson St
- 411 E South St
- 216 N Allen St
- 323 E South St
- 330 N Emmett St
- 716 S Walnut St
- 130 Megan Dr
- 422 S Main St
- 821 S Main St
- 000 N Main St
- 315 N Williams St
- 319 N Williams St
- 206 Glen Arbor Dr
- 0 Lynn St Unit 6110702
- 542 S Beech St
- 310 E Edgerton St
- 128 N Beech St
- 228 N Beech St
- 1006 S Beech St
- 311 W South St
Your Personal Tour Guide
Ask me questions while you tour the home.