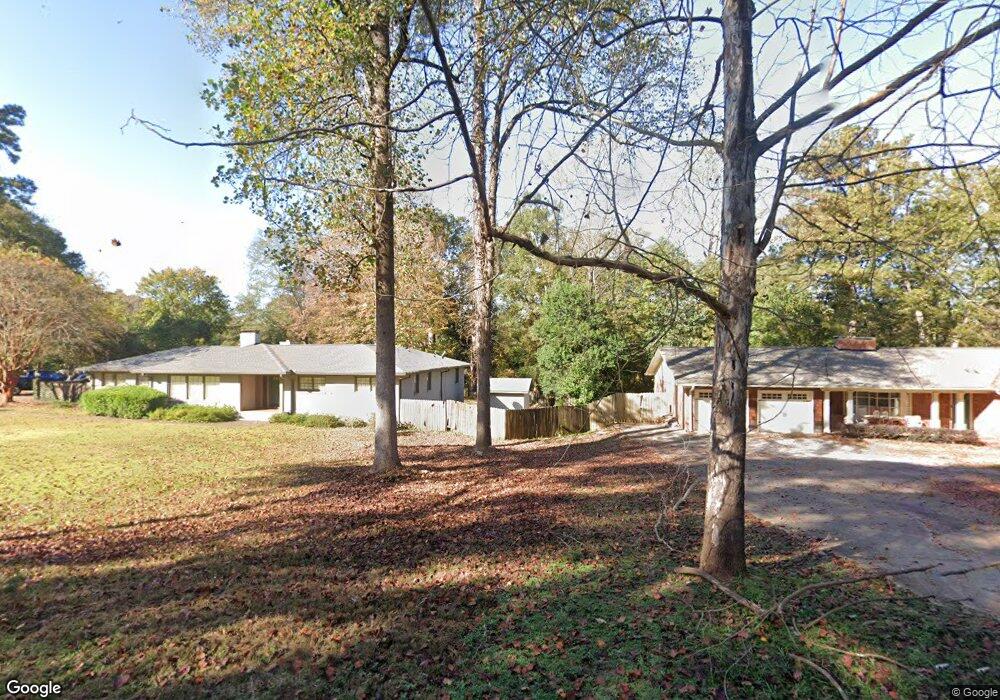
415 Pineview Terrace Lagrange, GA 30240
Estimated Value: $314,710 - $369,000
3
Beds
3
Baths
2,563
Sq Ft
$130/Sq Ft
Est. Value
About This Home
This home is located at 415 Pineview Terrace, Lagrange, GA 30240 and is currently estimated at $334,178, approximately $130 per square foot. 415 Pineview Terrace is a home located in Troup County with nearby schools including Hollis Hand Elementary School, Ethel W. Kight Elementary School, and Franklin Forest Elementary School.
Ownership History
Date
Name
Owned For
Owner Type
Purchase Details
Closed on
Feb 27, 2020
Sold by
Newman Judson Durand
Bought by
Newman Judson Durand and Newman Katherine Rice
Current Estimated Value
Home Financials for this Owner
Home Financials are based on the most recent Mortgage that was taken out on this home.
Original Mortgage
$222,888
Outstanding Balance
$196,120
Interest Rate
3.5%
Mortgage Type
FHA
Estimated Equity
$138,058
Purchase Details
Closed on
Mar 27, 2008
Sold by
Bass Robert T
Bought by
Vaughn Blake B
Home Financials for this Owner
Home Financials are based on the most recent Mortgage that was taken out on this home.
Original Mortgage
$156,750
Interest Rate
6.22%
Mortgage Type
New Conventional
Purchase Details
Closed on
Nov 27, 1991
Sold by
Memory S Johnson
Bought by
Bass Robert T
Purchase Details
Closed on
Jan 1, 1965
Sold by
Richard W Wolfe ?
Bought by
Memory S Johnson
Create a Home Valuation Report for This Property
The Home Valuation Report is an in-depth analysis detailing your home's value as well as a comparison with similar homes in the area
Purchase History
| Date | Buyer | Sale Price | Title Company |
|---|---|---|---|
| Newman Judson Durand | -- | -- | |
| Newman Judson Durand | $227,000 | -- | |
| Vaughn Blake B | $165,000 | -- | |
| Bass Robert T | -- | -- | |
| Memory S Johnson | -- | -- |
Source: Public Records
Mortgage History
| Date | Status | Borrower | Loan Amount |
|---|---|---|---|
| Open | Newman Judson Durand | $222,888 | |
| Closed | Newman Judson Durand | $222,888 | |
| Previous Owner | Vaughn Blake B | $156,750 |
Source: Public Records
Tax History
| Year | Tax Paid | Tax Assessment Tax Assessment Total Assessment is a certain percentage of the fair market value that is determined by local assessors to be the total taxable value of land and additions on the property. | Land | Improvement |
|---|---|---|---|---|
| 2025 | $2,652 | $116,000 | $18,000 | $98,000 |
| 2024 | $2,652 | $99,240 | $18,000 | $81,240 |
| 2023 | $2,550 | $95,480 | $18,000 | $77,480 |
| 2022 | $2,483 | $90,960 | $18,000 | $72,960 |
| 2021 | $2,679 | $93,240 | $18,000 | $75,240 |
| 2020 | $2,486 | $84,400 | $18,000 | $66,400 |
| 2019 | $1,552 | $53,440 | $10,000 | $43,440 |
| 2018 | $1,490 | $51,400 | $10,000 | $41,400 |
| 2017 | $1,397 | $48,320 | $9,600 | $38,720 |
| 2016 | $1,381 | $47,783 | $9,600 | $38,183 |
| 2015 | $1,396 | $48,198 | $10,015 | $38,183 |
| 2014 | $1,375 | $47,411 | $10,015 | $37,396 |
| 2013 | -- | $48,864 | $10,060 | $38,804 |
Source: Public Records
Map
Nearby Homes
- 705 Piney Woods Dr
- 216 E Lane Cir
- 203 Waverly Way
- 910 Piney Woods Dr
- 120 Saynor Cir
- 598 Edmondson Ave
- 105 Saynor Cir
- 0 Hills and Dales Farm Rd
- 0 N Lee St Unit 10550825
- 217 Jefferson St
- 119 College Ave
- 222 Beechwood Cir
- 208 Boulevard
- 206 Broad St
- 304 Boulevard
- 421 College Ave
- 416 Park Ave
- 109 Thomas St
- 405 W Broome St Unit 2
- 405 W Broome St Unit 3
- 419 Pineview Terrace
- 411 Pineview Terrace
- 418 Pineview Terrace
- 210 Westwood Dr
- 210 Ridgecrest Rd
- 206 Ridgecrest Rd
- 412 Pineview Terrace
- 424 Pineview Terrace
- 427 Pineview Terrace
- 704 Ridgecrest Rd
- 200 Ridgecrest Rd
- 220 Westwood Dr
- 426 Pineview Terrace
- 411 Ridgecrest Rd
- 741 Ridgecrest Rd
- 217 Ridgecrest Rd
- 405 Ridgecrest Rd
- 417 Ridgecrest Rd
- 211 Westwood Dr
- 100 Loyd Place
Your Personal Tour Guide
Ask me questions while you tour the home.