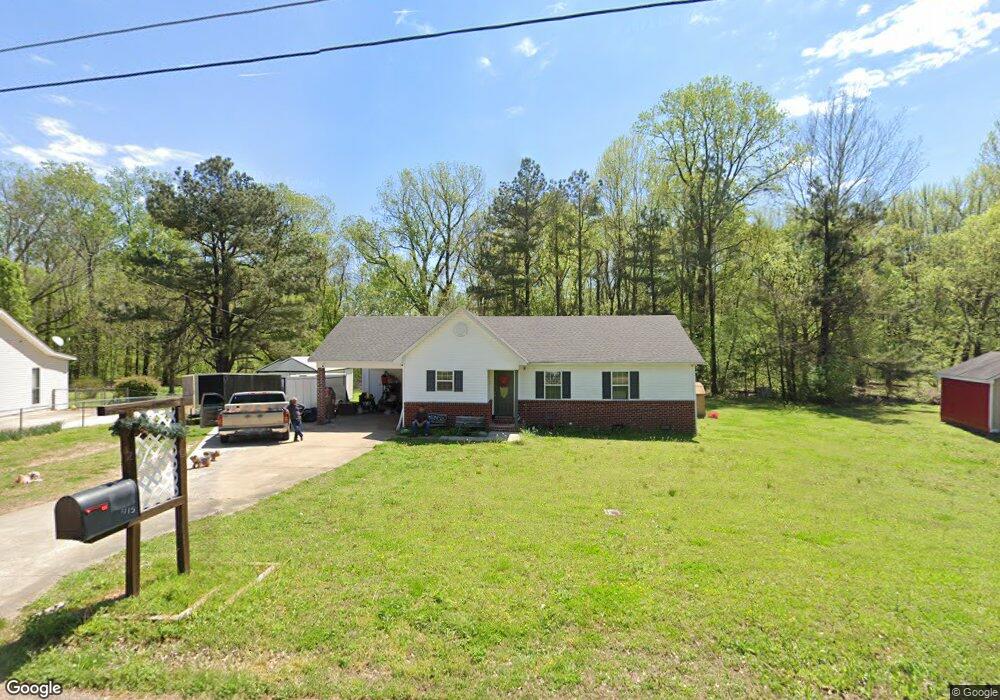
415 Pwr Loop Munford, TN 38058
Estimated Value: $231,852 - $242,000
Studio
2
Baths
1,220
Sq Ft
$194/Sq Ft
Est. Value
About This Home
This home is located at 415 Pwr Loop, Munford, TN 38058 and is currently estimated at $237,213, approximately $194 per square foot. 415 Pwr Loop is a home located in Tipton County with nearby schools including Drummonds Elementary School, Munford Middle School, and Munford High School.
Ownership History
Date
Name
Owned For
Owner Type
Purchase Details
Closed on
Jan 31, 2017
Sold by
Wilson William
Bought by
Garcia Lori Beth and Garcia Alfonso
Current Estimated Value
Home Financials for this Owner
Home Financials are based on the most recent Mortgage that was taken out on this home.
Original Mortgage
$87,979
Outstanding Balance
$72,315
Interest Rate
4.2%
Mortgage Type
New Conventional
Estimated Equity
$164,898
Purchase Details
Closed on
Nov 17, 2016
Sold by
Dudas Edward Andrew
Bought by
Wilson William and Wilson Kerri
Home Financials for this Owner
Home Financials are based on the most recent Mortgage that was taken out on this home.
Original Mortgage
$46,971
Interest Rate
3.52%
Mortgage Type
Purchase Money Mortgage
Purchase Details
Closed on
Jul 31, 1991
Bought by
Dudas Edward A
Purchase Details
Closed on
Feb 25, 1988
Bought by
Reed Paul Wayne
Create a Home Valuation Report for This Property
The Home Valuation Report is an in-depth analysis detailing your home's value as well as a comparison with similar homes in the area
Home Values in the Area
Average Home Value in this Area
Purchase History
| Date | Buyer | Sale Price | Title Company |
|---|---|---|---|
| Garcia Lori Beth | $85,000 | -- | |
| Wilson William | $40,000 | -- | |
| Dudas Edward A | $54,900 | -- | |
| Reed Paul Wayne | -- | -- |
Source: Public Records
Mortgage History
| Date | Status | Borrower | Loan Amount |
|---|---|---|---|
| Open | Garcia Lori Beth | $87,979 | |
| Previous Owner | Wilson William | $46,971 |
Source: Public Records
Tax History
| Year | Tax Paid | Tax Assessment Tax Assessment Total Assessment is a certain percentage of the fair market value that is determined by local assessors to be the total taxable value of land and additions on the property. | Land | Improvement |
|---|---|---|---|---|
| 2025 | $775 | $50,950 | $9,750 | $41,200 |
| 2024 | $765 | $50,300 | $9,750 | $40,550 |
| 2023 | $765 | $50,300 | $9,750 | $40,550 |
| 2022 | $724 | $35,475 | $7,175 | $28,300 |
| 2021 | $724 | $35,475 | $7,175 | $28,300 |
| 2020 | $723 | $35,475 | $7,175 | $28,300 |
| 2019 | $486 | $20,075 | $4,250 | $15,825 |
| 2018 | $463 | $19,125 | $4,250 | $14,875 |
| 2017 | $463 | $19,125 | $4,250 | $14,875 |
| 2016 | $463 | $19,125 | $4,250 | $14,875 |
| 2015 | $462 | $19,125 | $4,250 | $14,875 |
| 2014 | $462 | $19,113 | $0 | $0 |
Source: Public Records
Map
Nearby Homes
- 511 Rae Dr
- 447 Abbey Rd Unit D
- 447 Abbey Rd Unit A
- 37 N Wyatt Shankle Cove
- 59 Rose Bush St
- 53 Rose Bush St
- 0 Appleberry Rd
- 52 Green Meadows Blvd
- 110 Green Meadows Blvd
- 47 Rose Bush St
- 33 Rose Bush St
- 27 Rose Bush St
- 39 Rose Bush St
- 549 Mccormick Rd
- 632 Cullum Rd
- 20 Margaret Place
- 136 Windy Oaks Dr
- 1245 Drummonds Rd
- 0 Davidson Rd
- 232 Empire Ln
Your Personal Tour Guide
Ask me questions while you tour the home.