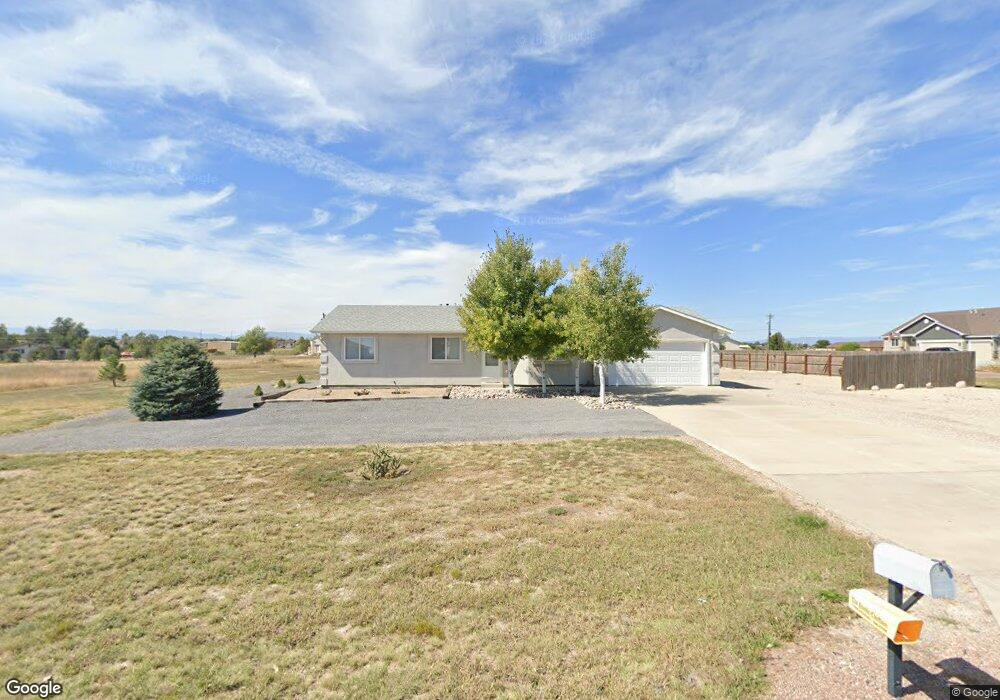
415 S Latimer Dr Pueblo, CO 81007
Estimated Value: $343,000 - $398,756
3
Beds
2
Baths
1,292
Sq Ft
$292/Sq Ft
Est. Value
About This Home
This home is located at 415 S Latimer Dr, Pueblo, CO 81007 and is currently estimated at $376,689, approximately $291 per square foot. 415 S Latimer Dr is a home located in Pueblo County with nearby schools including Liberty Point Elementary School, Liberty Point International School, and Pueblo West High School.
Ownership History
Date
Name
Owned For
Owner Type
Purchase Details
Closed on
Mar 23, 2012
Sold by
Jones Kenneth L and Jones Berta R
Bought by
Warner John D and Warner Norma L
Current Estimated Value
Purchase Details
Closed on
Apr 11, 2007
Sold by
Gem Homes Inc
Bought by
Jones Kenneth L and Jones Berta R
Home Financials for this Owner
Home Financials are based on the most recent Mortgage that was taken out on this home.
Original Mortgage
$95,920
Interest Rate
6.19%
Mortgage Type
New Conventional
Purchase Details
Closed on
Dec 27, 2006
Sold by
Jones Kenneth L and Jones Berta R
Bought by
Gem Homes Inc
Purchase Details
Closed on
Sep 25, 2006
Sold by
Woodhams William G and Woodhams Nancy
Bought by
Jones Kenneth L and Jones Berta R
Purchase Details
Closed on
Sep 4, 2006
Sold by
Woodhams William G
Bought by
Woodhams William G and Woodhams Nancy
Purchase Details
Closed on
Jan 5, 1977
Sold by
Lawyers Title Of Pueblo
Bought by
Wright Geneva M
Create a Home Valuation Report for This Property
The Home Valuation Report is an in-depth analysis detailing your home's value as well as a comparison with similar homes in the area
Home Values in the Area
Average Home Value in this Area
Purchase History
| Date | Buyer | Sale Price | Title Company |
|---|---|---|---|
| Warner John D | $135,000 | Land Title Guarantee Company | |
| Jones Kenneth L | $119,900 | Landamerica | |
| Gem Homes Inc | -- | Landamerica Lawyers Title | |
| Jones Kenneth L | $29,000 | None Available | |
| Woodhams William G | -- | None Available | |
| Wright Geneva M | $7,000 | -- |
Source: Public Records
Mortgage History
| Date | Status | Borrower | Loan Amount |
|---|---|---|---|
| Previous Owner | Jones Kenneth L | $95,920 |
Source: Public Records
Tax History Compared to Growth
Tax History
| Year | Tax Paid | Tax Assessment Tax Assessment Total Assessment is a certain percentage of the fair market value that is determined by local assessors to be the total taxable value of land and additions on the property. | Land | Improvement |
|---|---|---|---|---|
| 2024 | $2,120 | $21,120 | -- | -- |
| 2023 | $2,145 | $24,810 | $3,690 | $21,120 |
| 2022 | $1,856 | $18,499 | $2,290 | $16,209 |
| 2021 | $1,904 | $19,040 | $2,360 | $16,680 |
| 2020 | $1,564 | $19,040 | $2,360 | $16,680 |
| 2019 | $1,560 | $15,608 | $787 | $14,821 |
| 2018 | $1,356 | $13,563 | $792 | $12,771 |
| 2017 | $1,358 | $13,563 | $792 | $12,771 |
| 2016 | $1,294 | $12,945 | $1,075 | $11,870 |
| 2015 | $641 | $12,945 | $1,075 | $11,870 |
| 2014 | -- | $11,839 | $1,194 | $10,645 |
Source: Public Records
Map
Nearby Homes
- 416 S Hahns Peak Place
- 434 S Latimer Dr
- 356 S Tanager Ct
- 644 E Hahns Peak Ave
- 481 S Laporte Dr
- 489 S Laporte Dr
- 469 E Hahns Peak Ave
- 540 E Datura Dr
- 733 E Clarion Dr
- 671 E Clarion Dr
- 629 E Clarion Dr
- 321 S Bayfield Ave
- 391 E Springmont Dr
- 547 S Clarion Dr
- 713 E Springmont Dr
- 751 E Laporte Dr Unit A & B
- 705 E Springmont Dr
- 375 E Springmont Dr
- 363 E Springmont Dr
- 557 E Clarion Dr
- 564 S Hahns Peak Ave
- 410 S Latimer Dr
- 422 S Latimer Dr
- 561 E Hahns Peak Ave Unit 26
- 561 E Hahns Peak Ave
- 577 E Hahns Peak Ave
- 577 E Hahns Peak Ave Unit 24
- 547 E Hahns Peak Ave
- 439 S Latimer Dr
- 585 E Hahns Peak Ave
- 430 S Hahns Peak Place
- 415 S Hahns Peak Place
- 531 E Hahns Peak Ave
- 588 E Hahns Peak Ave
- 588 E Hahns Peak Ave Unit 4
- 331 S Tanager Ct
- 569 E Hahns Peak Ave Unit 25
- 456 S Latimer Dr
- 456 S Latimer Dr Unit 1
- 387 S Tanager Ct Unit 22