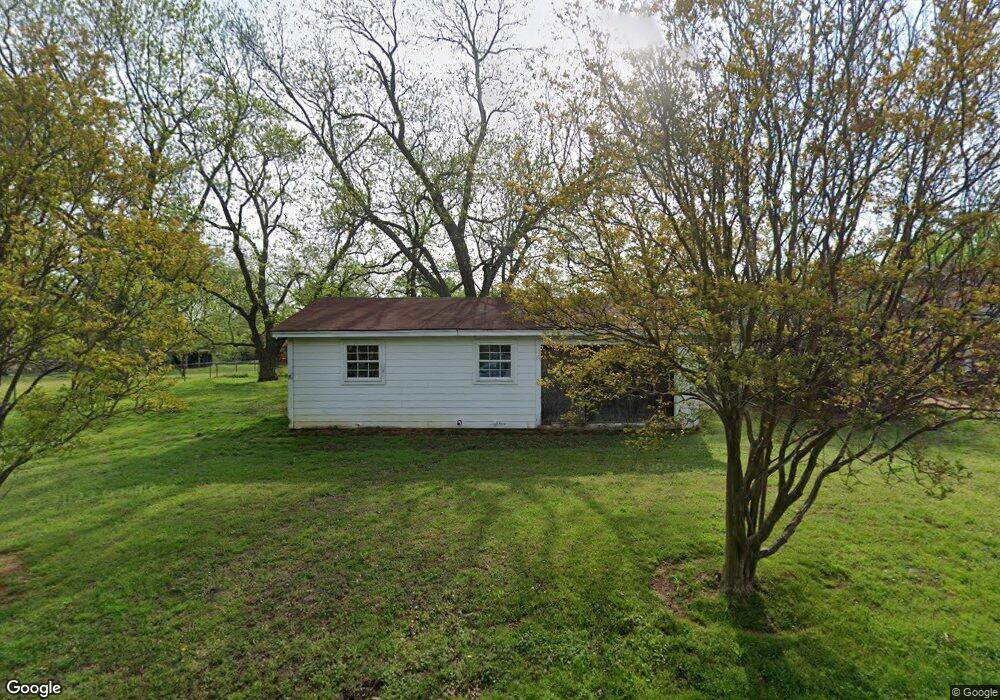
415 S Morrison St Pilot Point, TX 76258
Estimated Value: $117,282 - $282,000
2
Beds
1
Bath
809
Sq Ft
$235/Sq Ft
Est. Value
About This Home
This home is located at 415 S Morrison St, Pilot Point, TX 76258 and is currently estimated at $190,094, approximately $234 per square foot. 415 S Morrison St is a home located in Denton County with nearby schools including Pilot Point Early Childhood Center, Pilot Point Elementary School, and Pilot Point Middle School.
Ownership History
Date
Name
Owned For
Owner Type
Purchase Details
Closed on
Jul 25, 2008
Sold by
Hilliard Casie J
Bought by
Hilliard Terry J and Hilliard Rene S
Current Estimated Value
Home Financials for this Owner
Home Financials are based on the most recent Mortgage that was taken out on this home.
Original Mortgage
$14,600
Outstanding Balance
$9,575
Interest Rate
6.4%
Mortgage Type
Purchase Money Mortgage
Estimated Equity
$180,519
Create a Home Valuation Report for This Property
The Home Valuation Report is an in-depth analysis detailing your home's value as well as a comparison with similar homes in the area
Home Values in the Area
Average Home Value in this Area
Purchase History
| Date | Buyer | Sale Price | Title Company |
|---|---|---|---|
| Hilliard Terry J | -- | None Available |
Source: Public Records
Mortgage History
| Date | Status | Borrower | Loan Amount |
|---|---|---|---|
| Open | Hilliard Terry J | $14,600 |
Source: Public Records
Tax History Compared to Growth
Tax History
| Year | Tax Paid | Tax Assessment Tax Assessment Total Assessment is a certain percentage of the fair market value that is determined by local assessors to be the total taxable value of land and additions on the property. | Land | Improvement |
|---|---|---|---|---|
| 2025 | $1,584 | $82,000 | $68,803 | $13,197 |
| 2024 | $1,584 | $88,000 | $68,803 | $19,197 |
| 2023 | $1,711 | $92,000 | $63,964 | $28,036 |
| 2022 | $1,764 | $85,775 | $56,062 | $29,713 |
| 2021 | $1,645 | $79,734 | $56,062 | $23,672 |
| 2020 | $751 | $36,158 | $27,521 | $8,637 |
| 2019 | $776 | $36,213 | $27,521 | $8,692 |
| 2018 | $716 | $32,997 | $24,973 | $8,024 |
| 2017 | $691 | $31,761 | $23,444 | $8,317 |
| 2016 | $570 | $26,202 | $18,857 | $7,345 |
| 2015 | -- | $25,228 | $18,857 | $6,371 |
| 2013 | -- | $23,631 | $18,857 | $4,774 |
Source: Public Records
Map
Nearby Homes
- 192 Lakeview Cir
- 188 Lakeview Cir
- 184 Lakeview Cir
- 168 Lakeview Cir
- TBD W Clifton St
- 405 W Clifton St
- 400 S Washington St
- 326 W Liberty St
- 300 S Jefferson St
- 720 Vest Ln
- 106 W Main St
- 208 N Hill St
- 515 Eddleman St
- 717 S Church St
- 608 W Walcott St
- 137 Maverick Ln
- 301 E Division St
- 300 Bronco Dr
- 308 Bronco Dr
- 400 N Montague St
- 0000 W White St
- 416 W White St
- 426 S Morrison St
- 421 W Grove St
- 501 S Morrison St
- 415 W Grove St
- 410 W White St
- 216 Lakeview Cir
- 416 S Morrison St
- 423 W White St
- 203 Lake View Cir
- 417 W White St
- 203 Lakeview Cir
- 409 W Grove St
- 408 S Hill St
- 212 Lakeview Cir
- 212 Grove Cir
- 418 S Hill St
- 440 S Morrison St
- 426 S Hill St