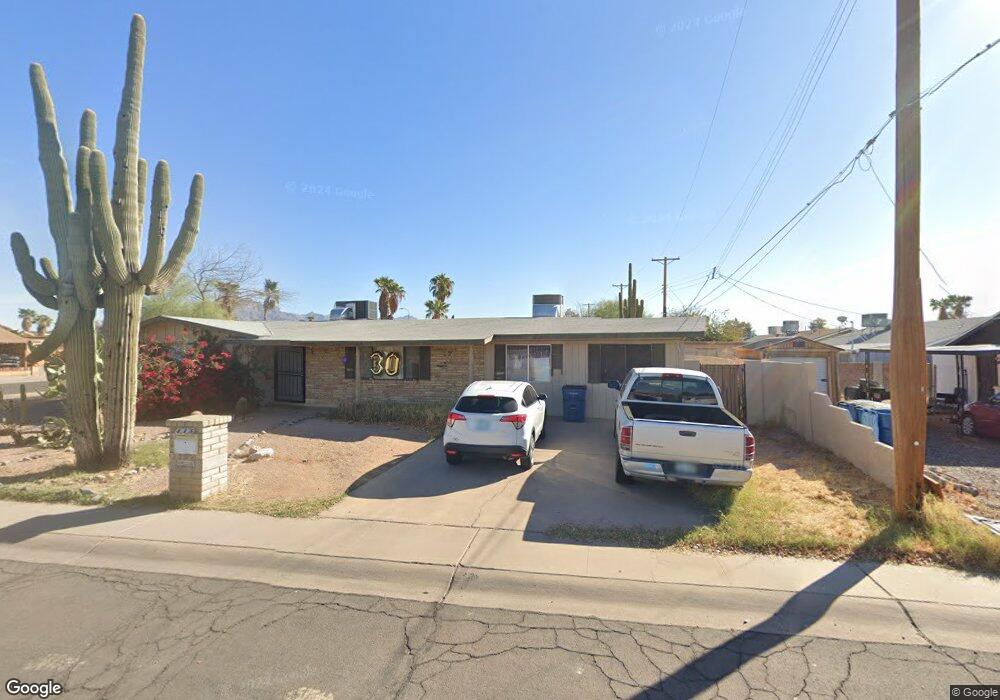
415 S Thunderbird Dr Apache Junction, AZ 85120
Estimated Value: $384,000 - $437,000
Studio
--
Bath
2,146
Sq Ft
$193/Sq Ft
Est. Value
About This Home
This home is located at 415 S Thunderbird Dr, Apache Junction, AZ 85120 and is currently estimated at $413,212, approximately $192 per square foot. 415 S Thunderbird Dr is a home located in Pinal County with nearby schools including Four Peaks Elementary School, Cactus Canyon Junior High School, and Apache Junction High School.
Ownership History
Date
Name
Owned For
Owner Type
Purchase Details
Closed on
Apr 16, 2013
Sold by
Holman Richard D and Holman Debra J
Bought by
Holman Richard D and Holman Debra J
Current Estimated Value
Purchase Details
Closed on
Mar 20, 2002
Sold by
Borowski Mark G and Johnson Susan
Bought by
Holman Richard D and Holman Debra J
Purchase Details
Closed on
Oct 25, 1999
Sold by
Gilliam Terence L and Gilliam Colleen A
Bought by
Borowski Mark G and Johnson Susan
Home Financials for this Owner
Home Financials are based on the most recent Mortgage that was taken out on this home.
Original Mortgage
$88,800
Interest Rate
10.5%
Mortgage Type
Seller Take Back
Purchase Details
Closed on
May 30, 1995
Sold by
Gilliam Dione M
Bought by
Gilliam Terence L and Gilliam Colleen A
Home Financials for this Owner
Home Financials are based on the most recent Mortgage that was taken out on this home.
Original Mortgage
$29,771
Interest Rate
8.36%
Create a Home Valuation Report for This Property
The Home Valuation Report is an in-depth analysis detailing your home's value as well as a comparison with similar homes in the area
Home Values in the Area
Average Home Value in this Area
Purchase History
| Date | Buyer | Sale Price | Title Company |
|---|---|---|---|
| Holman Richard D | -- | None Available | |
| Holman Richard D | $101,000 | -- | |
| Borowski Mark G | $111,000 | Transnation Title Ins Co | |
| Gilliam Terence L | -- | First American Title |
Source: Public Records
Mortgage History
| Date | Status | Borrower | Loan Amount |
|---|---|---|---|
| Previous Owner | Borowski Mark G | $88,800 | |
| Previous Owner | Gilliam Terence L | $29,771 | |
| Closed | Borowski Mark G | $11,100 |
Source: Public Records
Tax History
| Year | Tax Paid | Tax Assessment Tax Assessment Total Assessment is a certain percentage of the fair market value that is determined by local assessors to be the total taxable value of land and additions on the property. | Land | Improvement |
|---|---|---|---|---|
| 2025 | $1,637 | $41,564 | -- | -- |
| 2024 | $1,545 | $41,695 | -- | -- |
| 2023 | $1,612 | $32,739 | $0 | $0 |
| 2022 | $1,545 | $24,088 | $8,307 | $15,781 |
| 2021 | $1,574 | $22,539 | $0 | $0 |
| 2020 | $1,534 | $20,841 | $0 | $0 |
| 2019 | $1,476 | $20,160 | $0 | $0 |
| 2018 | $1,443 | $12,469 | $0 | $0 |
| 2017 | $1,248 | $10,774 | $0 | $0 |
| 2016 | $1,213 | $10,256 | $2,200 | $8,056 |
| 2014 | $1,181 | $7,567 | $2,200 | $5,367 |
Source: Public Records
Map
Nearby Homes
- 1059 W 5th Ave
- 337 S Thunderbird Dr
- 1181 W 4th Ave
- 1183 W Rosal Ave
- 861 W 5th Ave
- 449 S Gold Dr
- 637 S Copper Dr
- 880 S Buena Vista Dr
- 894 S Buena Vista Dr
- 720 S Del Rio Ct
- XXX E Compound Lot 2 B Trail Unit B
- 1517 W Roosevelt St Unit A
- 831 S Phelps Dr
- 2090 S Cherokee Ave
- 800 W Apache Trail Unit 77
- 800 W Apache Trail Unit 24
- 800 W Apache Trail Unit 18
- 800 W Apache Trail Unit 93
- 1206 W Klamath Ave
- 2205 W Klamath Ave Unit 205
- 1033 W 4th Ave
- 437 S Thunderbird Dr Unit 1
- 1046 W 5th Ave
- 1018 W 5th Ave
- 1034 W 4th Ave Unit COZY
- 1034 W 4th Ave
- 995 W 4th Ave
- 1010 W 4th Ave
- 1010 W 5th Ave
- 402 S Thunderbird Dr
- 357 S Thunderbird Dr
- 430 S Thunderbird Dr
- 351 S Thunderbird Dr
- 986 W 5th Ave
- 973 W 4th Ave
- 362 S Weaver Dr Unit 1
- 1047 W 5th Ave
- 1059 W 5th Ave Unit 70
- 966 W 4th Ave
- 350 S Thunderbird Dr Unit 1
Your Personal Tour Guide
Ask me questions while you tour the home.