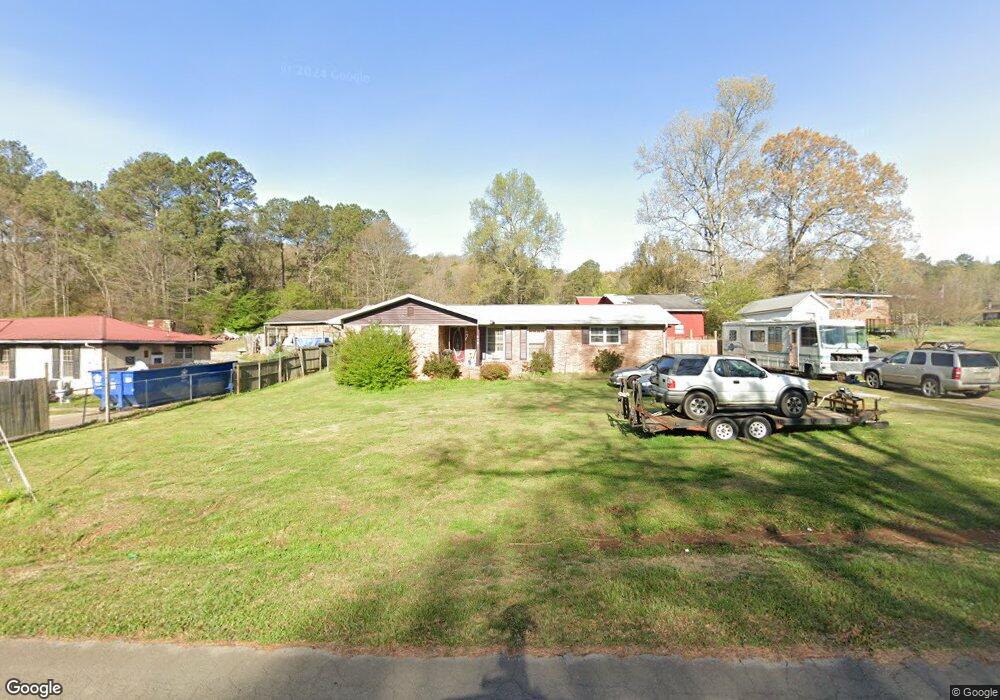
415 Spring Village Rd SE Lindale, GA 30147
Estimated Value: $210,189 - $267,000
--
Bed
--
Bath
1,486
Sq Ft
$160/Sq Ft
Est. Value
About This Home
This home is located at 415 Spring Village Rd SE, Lindale, GA 30147 and is currently estimated at $237,547, approximately $159 per square foot. 415 Spring Village Rd SE is a home located in Floyd County with nearby schools including Pepperell Middle School and Pepperell High School.
Ownership History
Date
Name
Owned For
Owner Type
Purchase Details
Closed on
Jun 15, 2007
Sold by
Not Provided
Bought by
Amore Amore Steven D Steven D and Amore Chada T
Current Estimated Value
Home Financials for this Owner
Home Financials are based on the most recent Mortgage that was taken out on this home.
Original Mortgage
$84,000
Outstanding Balance
$51,316
Interest Rate
6.16%
Mortgage Type
New Conventional
Estimated Equity
$186,231
Purchase Details
Closed on
Apr 28, 1983
Sold by
Cain Troy R and Cain Dianes L
Bought by
Middleton David J and Susan Middleton
Purchase Details
Closed on
Nov 28, 1978
Sold by
Jones Cecil Terry
Bought by
Cain Troy R and Cain Dianes L
Purchase Details
Closed on
Jul 5, 1968
Sold by
Leithauser Don G
Bought by
Jones Cecil Terry
Purchase Details
Closed on
Feb 24, 1968
Bought by
P and R
Purchase Details
Closed on
Feb 24, 1965
Bought by
Leithauser Don G
Create a Home Valuation Report for This Property
The Home Valuation Report is an in-depth analysis detailing your home's value as well as a comparison with similar homes in the area
Home Values in the Area
Average Home Value in this Area
Purchase History
| Date | Buyer | Sale Price | Title Company |
|---|---|---|---|
| Amore Amore Steven D Steven D | -- | -- | |
| Amore Amore Steven D Steven D | $105,000 | -- | |
| Middleton David J | $29,400 | -- | |
| Cain Troy R | $28,000 | -- | |
| Jones Cecil Terry | $17,500 | -- | |
| P | -- | -- | |
| Leithauser Don G | -- | -- |
Source: Public Records
Mortgage History
| Date | Status | Borrower | Loan Amount |
|---|---|---|---|
| Open | Amore Amore Steven D Steven D | $84,000 | |
| Closed | Amore Amore Steven D Steven D | $84,000 |
Source: Public Records
Tax History Compared to Growth
Tax History
| Year | Tax Paid | Tax Assessment Tax Assessment Total Assessment is a certain percentage of the fair market value that is determined by local assessors to be the total taxable value of land and additions on the property. | Land | Improvement |
|---|---|---|---|---|
| 2024 | $2,138 | $71,747 | $10,644 | $61,103 |
| 2023 | $1,891 | $62,967 | $9,677 | $53,290 |
| 2022 | $1,616 | $51,534 | $7,742 | $43,792 |
| 2021 | $1,495 | $46,744 | $7,742 | $39,002 |
| 2020 | $1,373 | $42,476 | $5,806 | $36,670 |
| 2019 | $1,299 | $40,758 | $5,806 | $34,952 |
| 2018 | $1,244 | $38,943 | $5,806 | $33,137 |
| 2017 | $1,220 | $38,066 | $5,806 | $32,260 |
| 2016 | $1,217 | $37,490 | $5,800 | $31,690 |
| 2015 | $1,193 | $37,490 | $5,800 | $31,690 |
| 2014 | $1,193 | $37,490 | $5,800 | $31,690 |
Source: Public Records
Map
Nearby Homes
- 27 Hughes Dairy Rd SE
- 0 Booze Mountain Rd Unit 10580353
- 305 Grove Ave SE
- 81 Hughes Dairy Rd
- 1572 Booze Mountain Rd SE
- 202 Park Ave SE
- 13 N Terrace Ave SE
- 612 Eden Valley Rd SE
- 184 Conns Lake Extension
- 6 Hillside Ave SE
- 12 Circle Dr SE
- 0 S Edenfield Ridge Dr SE
- 12 Indian River Rd SE
- 514 Booze Mountain Rd SE
- 1380 Old Cedartown Rd SE
- 113 Avenue D SE
- 0 Edenfield Dr SE Unit 21222627
- 4 Club View Dr SE
- Lot 54 Ridgeview Dr SE
- 11 Ridgeview Dr SE
- 400 Dewberry Ln SE
- 402 Dewberry Ln SE
- 404 Dewberry Ln SE
- 411 Spring Village Rd SE
- 416 Spring Village Rd SE
- 418 Spring Village Rd SE
- 420 Spring Village Rd SE Unit 32
- 420 Spring Village Rd SE
- Lot 26 Dewberry Ln
- 0 Dewberry Ln SE Unit 8260798
- 0 Dewberry Ln SE Unit 7609551
- 0 Dewberry Ln SE Unit 8168688
- 0 Dewberry Ln SE
- 414 Spring Village Rd SE
- 408 Dewberry Ln SE
- 403 Dewberry Ln SE
- 412 Spring Village Rd SE
- 409 Spring Village Rd SE
- 405 Dewberry Ln SE
- 401 Dewberry Ln SE