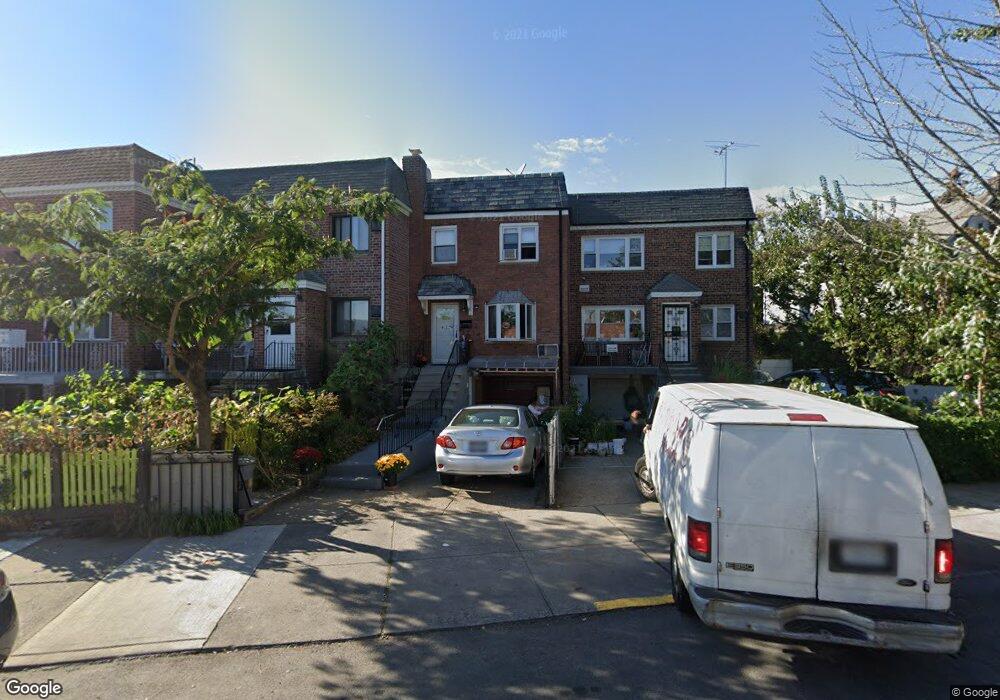
4150 171st St Flushing, NY 11358
Flushing NeighborhoodEstimated Value: $904,000 - $1,107,000
Studio
--
Bath
1,683
Sq Ft
$596/Sq Ft
Est. Value
About This Home
This home is located at 4150 171st St, Flushing, NY 11358 and is currently estimated at $1,003,641, approximately $596 per square foot. 4150 171st St is a home located in Queens County with nearby schools including P.S. 107 Thomas A Dooley, I.S. 25 Adrien Block, and Francis Lewis High School.
Ownership History
Date
Name
Owned For
Owner Type
Purchase Details
Closed on
Nov 1, 2016
Sold by
Tang Kai Ping and Zhong Sheng
Bought by
Zhong Sheng
Current Estimated Value
Purchase Details
Closed on
Mar 22, 2013
Sold by
Kim Jane
Bought by
Tang Kai Ping and Zhong Sheng
Purchase Details
Closed on
Nov 28, 2006
Sold by
Lee Chang Kyu
Bought by
Kim Jane
Home Financials for this Owner
Home Financials are based on the most recent Mortgage that was taken out on this home.
Original Mortgage
$400,000
Interest Rate
6.31%
Mortgage Type
Purchase Money Mortgage
Purchase Details
Closed on
Feb 16, 2006
Sold by
Lee Chang Kyu and Lee Yon Kyu
Bought by
Lee Chang Kyu
Purchase Details
Closed on
May 15, 2003
Sold by
Brasen Annette and Brasen James C
Bought by
Lee Chang K and Lee Yon K
Create a Home Valuation Report for This Property
The Home Valuation Report is an in-depth analysis detailing your home's value as well as a comparison with similar homes in the area
Home Values in the Area
Average Home Value in this Area
Purchase History
| Date | Buyer | Sale Price | Title Company |
|---|---|---|---|
| Zhong Sheng | -- | -- | |
| Zhong Sheng | -- | -- | |
| Zhong Sheng | -- | -- | |
| Tang Kai Ping | $535,000 | -- | |
| Tang Kai Ping | $535,000 | -- | |
| Kim Jane | $530,000 | -- | |
| Kim Jane | $530,000 | -- | |
| Lee Chang Kyu | -- | -- | |
| Lee Chang Kyu | -- | -- | |
| Lee Chang K | $400,000 | -- | |
| Lee Chang K | $400,000 | -- |
Source: Public Records
Mortgage History
| Date | Status | Borrower | Loan Amount |
|---|---|---|---|
| Previous Owner | Kim Jane | $400,000 | |
| Closed | Lee Chang K | $0 |
Source: Public Records
Tax History
| Year | Tax Paid | Tax Assessment Tax Assessment Total Assessment is a certain percentage of the fair market value that is determined by local assessors to be the total taxable value of land and additions on the property. | Land | Improvement |
|---|---|---|---|---|
| 2025 | $8,036 | $42,408 | $12,833 | $29,575 |
| 2024 | $8,036 | $40,012 | $11,828 | $28,184 |
| 2023 | $8,036 | $40,012 | $11,952 | $28,060 |
| 2022 | $7,523 | $53,280 | $15,360 | $37,920 |
| 2021 | $7,883 | $57,000 | $15,360 | $41,640 |
| 2020 | $7,480 | $51,600 | $15,360 | $36,240 |
| 2019 | $6,975 | $56,820 | $15,360 | $41,460 |
| 2018 | $6,797 | $33,343 | $10,887 | $22,456 |
| 2017 | $6,745 | $33,087 | $11,980 | $21,107 |
| 2016 | $6,240 | $33,087 | $11,980 | $21,107 |
| 2015 | $3,765 | $29,450 | $14,010 | $15,440 |
| 2014 | $3,765 | $27,786 | $14,244 | $13,542 |
Source: Public Records
Map
Nearby Homes
- 4116 169th St
- 43-52 169th St
- 4328 168th St
- 167-22 Northern Blvd
- 188-02 Northern Blvd
- 42-25 189th St
- 3639 171st St Unit 26
- 36-35 171st St Unit 30
- 36-40 167th St
- 190-17 42nd Ave
- 36-07 171st St Unit 35
- 189-23 39th Ave Unit 122
- 167-10 Crocheron Ave Unit 1F
- 4564 170th St
- 45-32 Utopia Pkwy
- 172-12 Crocheron Ave Unit C3
- 4018 165th St
- 35-63 168th St
- 190-05 39th Ave Unit 140
- 190-05 39th Ave Unit 142
- 41-50 171st St
- 41-50 171st St Unit 1,2Fl
- 4148 171st St Unit 2nd Fl
- 4148 171st St
- 4148 171st St Unit 2Fl
- 4152 171st St
- 4148 171st St
- 41-48 171st St
- 4154 171st St
- 4144 171st St
- 4147 170th St
- 41-47 170th St Unit 2F
- 4145 170th St
- 4140 171st St
- 4143 170th St
- 4145 170th St
- 4145 170th St Unit 2FL
- 4145 170th St Unit 2FL
- 4141 170th St
- 4143 170th St
Your Personal Tour Guide
Ask me questions while you tour the home.