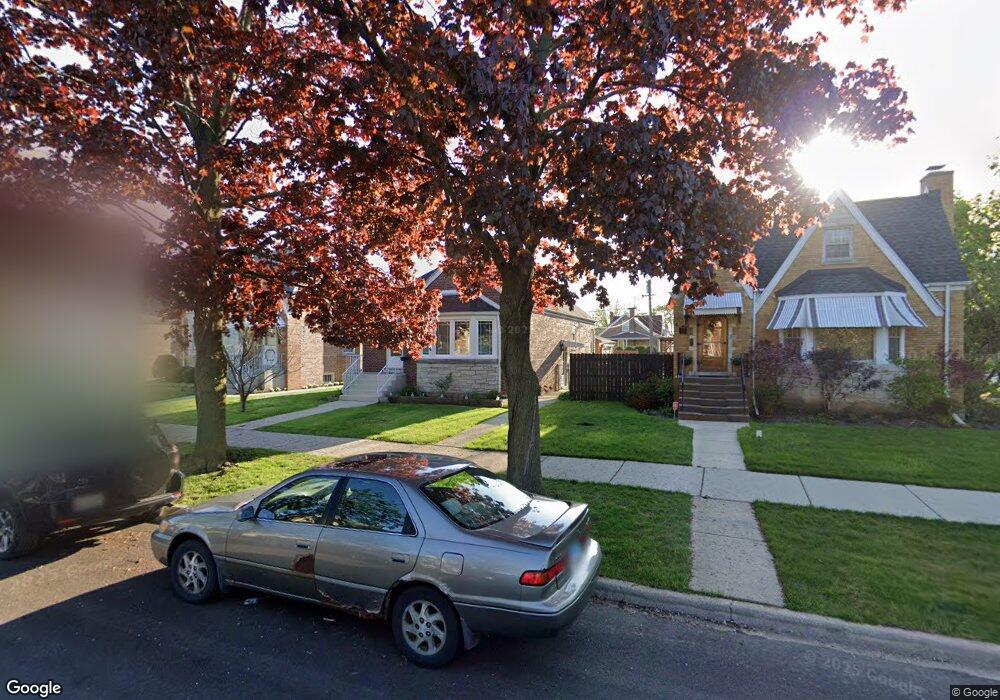
4152 N Mango Ave Chicago, IL 60634
Portage Park NeighborhoodEstimated Value: $428,000 - $479,000
3
Beds
2
Baths
1,174
Sq Ft
$383/Sq Ft
Est. Value
About This Home
This home is located at 4152 N Mango Ave, Chicago, IL 60634 and is currently estimated at $449,715, approximately $383 per square foot. 4152 N Mango Ave is a home located in Cook County with nearby schools including Portage Park Elementary School, Schurz High School, and Pope Francis Global Academy.
Ownership History
Date
Name
Owned For
Owner Type
Purchase Details
Closed on
Jun 22, 2017
Sold by
Mckune Daniel J and Mckune Kathleen E
Bought by
Spears Gina M
Current Estimated Value
Home Financials for this Owner
Home Financials are based on the most recent Mortgage that was taken out on this home.
Original Mortgage
$299,250
Outstanding Balance
$247,809
Interest Rate
4.12%
Mortgage Type
New Conventional
Estimated Equity
$201,906
Purchase Details
Closed on
Dec 8, 2005
Sold by
Mckune Daniel J and Mc Kune Kathleen E
Bought by
Mckune Daniel J and Mc Kune Kathleen E
Purchase Details
Closed on
Nov 17, 1998
Sold by
Espinal Carlos and Espinal Susan M
Bought by
Mckune Daniel J and Mckune Kathleen E
Home Financials for this Owner
Home Financials are based on the most recent Mortgage that was taken out on this home.
Original Mortgage
$112,250
Interest Rate
7.1%
Create a Home Valuation Report for This Property
The Home Valuation Report is an in-depth analysis detailing your home's value as well as a comparison with similar homes in the area
Home Values in the Area
Average Home Value in this Area
Purchase History
| Date | Buyer | Sale Price | Title Company |
|---|---|---|---|
| Spears Gina M | $315,000 | Chicago Title | |
| Mckune Daniel J | -- | -- | |
| Mckune Daniel J | $163,000 | Professional National Title |
Source: Public Records
Mortgage History
| Date | Status | Borrower | Loan Amount |
|---|---|---|---|
| Open | Spears Gina M | $299,250 | |
| Previous Owner | Mckune Daniel J | $112,250 |
Source: Public Records
Tax History
| Year | Tax Paid | Tax Assessment Tax Assessment Total Assessment is a certain percentage of the fair market value that is determined by local assessors to be the total taxable value of land and additions on the property. | Land | Improvement |
|---|---|---|---|---|
| 2025 | $7,085 | $38,256 | $17,500 | $20,756 |
| 2024 | $7,085 | $40,229 | $17,500 | $22,729 |
| 2023 | $6,885 | $36,893 | $14,000 | $22,893 |
| 2022 | $6,885 | $36,893 | $14,000 | $22,893 |
| 2021 | $7,977 | $43,000 | $14,000 | $29,000 |
| 2020 | $4,903 | $25,110 | $7,250 | $17,860 |
| 2019 | $4,917 | $27,901 | $7,250 | $20,651 |
| 2018 | $5,511 | $27,901 | $7,250 | $20,651 |
| 2017 | $6,170 | $28,662 | $6,500 | $22,162 |
| 2016 | $4,883 | $28,662 | $6,500 | $22,162 |
| 2015 | $4,772 | $28,662 | $6,500 | $22,162 |
| 2014 | $4,387 | $26,213 | $6,000 | $20,213 |
| 2013 | $4,289 | $26,213 | $6,000 | $20,213 |
Source: Public Records
Map
Nearby Homes
- 4025 N Menard Ave
- 4036 N Parkside Ave
- 5706 W Dakin St
- 4314 N Menard Ave
- 5752 W Byron St
- 5622 W Pensacola Ave
- 4065 N Meade Ave
- 5700 W Grace St
- 5525 W Berenice Ave
- 5758 W Warwick Ave
- 6007 W Berenice Ave
- 3746 N Central Ave Unit 3D
- 5541 W Grace St
- 5401 W Montrose Ave
- 5311 W Belle Plaine Ave
- 5354 W Montrose Ave
- 6109 W Berenice Ave
- 5410 W Grace St
- 5428 W Sunnyside Ave
- 6226 W Irving Park Rd
- 4148 N Mango Ave
- 4156 N Mango Ave
- 4144 N Mango Ave
- 4142 N Mango Ave
- 4153 N Menard Ave
- 4138 N Mango Ave
- 4149 N Menard Ave
- 4157 N Menard Ave
- 4145 N Menard Ave
- 4141 N Menard Ave
- 4134 N Mango Ave
- 4153 N Mango Ave
- 4149 N Mango Ave
- 4157 N Mango Ave
- 4139 N Menard Ave
- 4145 N Mango Ave
- 4141 N Mango Ave
- 4135 N Menard Ave
- 4139 N Mango Ave
- 4128 N Mango Ave
Your Personal Tour Guide
Ask me questions while you tour the home.