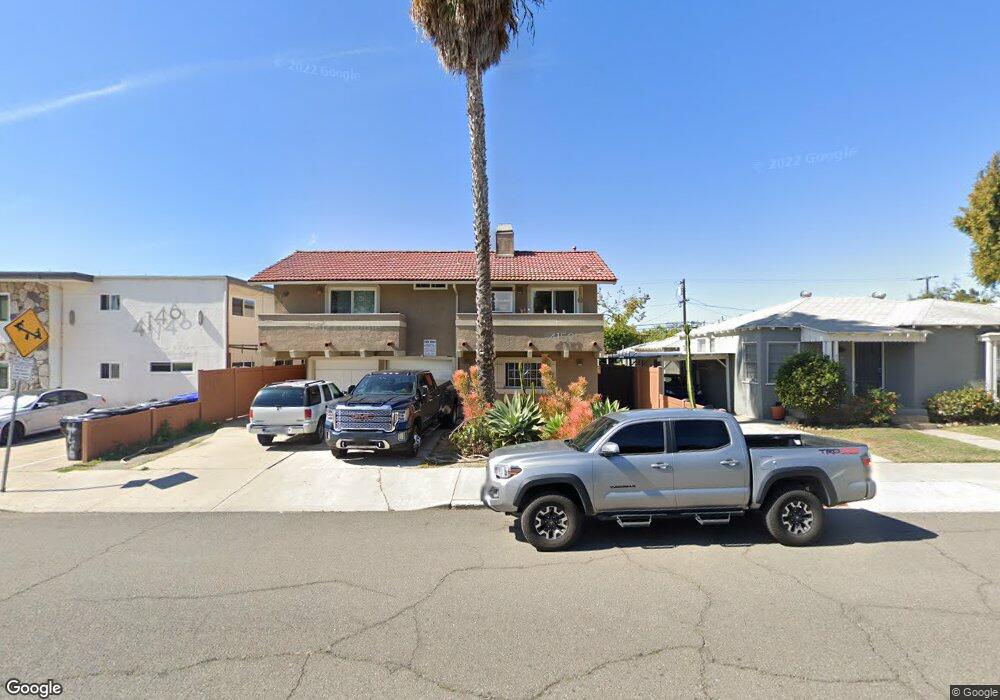
4152 Oregon St Unit 5 San Diego, CA 92104
North Park NeighborhoodEstimated Value: $406,127 - $437,000
1
Bed
1
Bath
576
Sq Ft
$736/Sq Ft
Est. Value
About This Home
This home is located at 4152 Oregon St Unit 5, San Diego, CA 92104 and is currently estimated at $424,032, approximately $736 per square foot. 4152 Oregon St Unit 5 is a home located in San Diego County with nearby schools including Garfield Elementary, Roosevelt International Middle School, and Kindred Montessori.
Ownership History
Date
Name
Owned For
Owner Type
Purchase Details
Closed on
Jun 7, 2024
Sold by
Sandman Family Trust and Sandman Jill M
Bought by
Sandman Martin J
Current Estimated Value
Purchase Details
Closed on
Mar 19, 2009
Sold by
Wells Fargo Bank Na
Bought by
Sandman Martin D and Sandman Judith M
Purchase Details
Closed on
Nov 30, 2007
Sold by
Lyons Latrina
Bought by
Wells Fargo Bank Na
Purchase Details
Closed on
Jun 6, 2006
Sold by
Home Richard M and Home Patricia Anne
Bought by
Lyons Latrina
Home Financials for this Owner
Home Financials are based on the most recent Mortgage that was taken out on this home.
Original Mortgage
$47,200
Interest Rate
6.56%
Mortgage Type
Stand Alone Second
Purchase Details
Closed on
Dec 18, 2004
Sold by
Home Richard and Home Patricia
Bought by
Home Richard M and Home Patricia Anne
Purchase Details
Closed on
Dec 9, 2004
Sold by
Udwin Alan M and Udwin Lisa Ellen
Bought by
Home Richard and Home Patricia
Create a Home Valuation Report for This Property
The Home Valuation Report is an in-depth analysis detailing your home's value as well as a comparison with similar homes in the area
Home Values in the Area
Average Home Value in this Area
Purchase History
| Date | Buyer | Sale Price | Title Company |
|---|---|---|---|
| Sandman Martin J | -- | None Listed On Document | |
| Sandman Martin D | $110,000 | Lsi Title Company | |
| Wells Fargo Bank Na | $199,000 | Accommodation | |
| Lyons Latrina | $245,500 | Stewart Title Of California | |
| Home Richard M | -- | -- | |
| Home Richard | -- | -- |
Source: Public Records
Mortgage History
| Date | Status | Borrower | Loan Amount |
|---|---|---|---|
| Previous Owner | Lyons Latrina | $47,200 | |
| Previous Owner | Lyons Latrina | $188,800 |
Source: Public Records
Tax History Compared to Growth
Tax History
| Year | Tax Paid | Tax Assessment Tax Assessment Total Assessment is a certain percentage of the fair market value that is determined by local assessors to be the total taxable value of land and additions on the property. | Land | Improvement |
|---|---|---|---|---|
| 2025 | $1,760 | $442,170 | $244,494 | $197,676 |
| 2024 | $1,760 | $138,861 | $75,744 | $63,117 |
| 2023 | $1,720 | $136,139 | $74,259 | $61,880 |
| 2022 | $1,674 | $133,470 | $72,803 | $60,667 |
| 2021 | $1,661 | $130,854 | $71,376 | $59,478 |
| 2020 | $1,641 | $129,514 | $70,645 | $58,869 |
| 2019 | $1,613 | $126,975 | $69,260 | $57,715 |
| 2018 | $1,510 | $124,486 | $67,902 | $56,584 |
| 2017 | $83 | $122,046 | $66,571 | $55,475 |
| 2016 | $1,450 | $119,654 | $65,266 | $54,388 |
| 2015 | $1,429 | $117,858 | $64,286 | $53,572 |
| 2014 | $1,407 | $115,550 | $63,027 | $52,523 |
Source: Public Records
Map
Nearby Homes
- 4130 Oregon St
- 4075 Idaho St Unit 2
- 4162 Arizona St
- 2416 Polk Ave
- 4153-55 Utah St
- 4226 Utah St
- 4043 Utah St Unit 3
- 4043 Utah St Unit 8
- 3933-45 Hamilton St
- 3970 Utah St Unit 9
- 4329 Idaho St Unit 104
- 4185 Louisiana St Unit 7
- 4119-23 Kansas
- 3946 Utah St Unit 3
- 4005 Louisiana St Unit 1
- 4180 Louisiana St Unit 1H
- 4074 30th St
- 4381 Oregon St Unit 6
- 4367 Idaho St Unit 5
- 2828 University Ave Unit 503
- 4152 Oregon St Unit . 8
- 4152 Oregon St Unit 8
- 4152 Oregon St Unit 7
- 4152 Oregon St Unit 6
- 4152 Oregon St Unit 4
- 4152 Oregon St Unit 3
- 4152 Oregon St Unit 2
- 4152 Oregon St Unit 1
- 4158 Oregon St Unit 62
- 4146 Oregon St
- 4162 Oregon St
- 4134-40 Oregon St
- 4134 Oregon St
- 4134 Oregon St
- 4166 Oregon St
- 4170 Oregon St
- 4176 Oregon St
- 4132 Oregon St
- 4132 Oregon St Unit B
- 4132 Oregon St Unit A