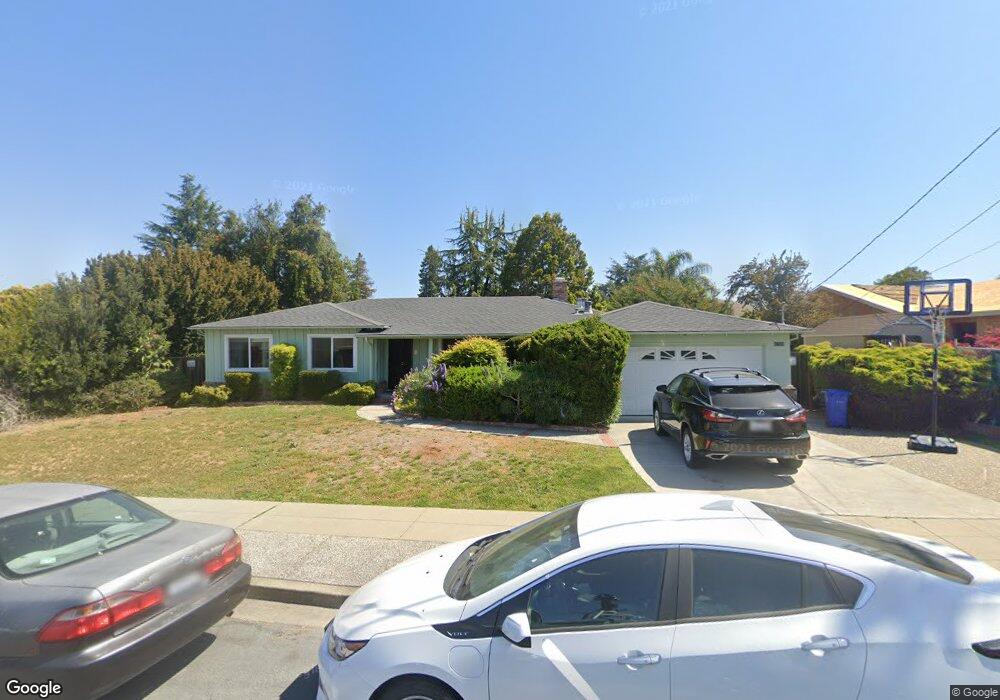
41528 Chiltern Dr Fremont, CA 94539
Mission Valley NeighborhoodEstimated Value: $2,303,000 - $2,699,000
3
Beds
3
Baths
1,757
Sq Ft
$1,432/Sq Ft
Est. Value
About This Home
This home is located at 41528 Chiltern Dr, Fremont, CA 94539 and is currently estimated at $2,516,807, approximately $1,432 per square foot. 41528 Chiltern Dr is a home located in Alameda County with nearby schools including Joshua Chadbourne Elementary School, William Hopkins Junior High School, and Mission San Jose High School.
Ownership History
Date
Name
Owned For
Owner Type
Purchase Details
Closed on
Nov 2, 2016
Sold by
Soin Tarun and Nagpal Punam
Bought by
Soin Tarun and Nagpal Punam
Current Estimated Value
Home Financials for this Owner
Home Financials are based on the most recent Mortgage that was taken out on this home.
Original Mortgage
$186,000
Outstanding Balance
$25,175
Interest Rate
3.48%
Mortgage Type
New Conventional
Estimated Equity
$2,491,632
Purchase Details
Closed on
May 22, 2014
Sold by
Soin Tarun and Nagpal Punam
Bought by
Soin 2014 Trust
Purchase Details
Closed on
Jun 30, 2011
Sold by
Galvan Marlene and Survivors Trust
Bought by
Soin Tarun and Nagpal Punam
Home Financials for this Owner
Home Financials are based on the most recent Mortgage that was taken out on this home.
Original Mortgage
$708,750
Outstanding Balance
$463,735
Interest Rate
3.5%
Mortgage Type
New Conventional
Estimated Equity
$2,053,072
Purchase Details
Closed on
Jun 21, 1996
Sold by
Dutra Alma M and Dutra Family Trust
Bought by
Dutra Alma M and Galvan Marlene
Create a Home Valuation Report for This Property
The Home Valuation Report is an in-depth analysis detailing your home's value as well as a comparison with similar homes in the area
Home Values in the Area
Average Home Value in this Area
Purchase History
| Date | Buyer | Sale Price | Title Company |
|---|---|---|---|
| Soin Tarun | -- | Accommodation | |
| Soin Tarun | -- | Chicago Title Company | |
| Soin 2014 Trust | -- | None Available | |
| Soin Tarun | $945,000 | Chicago Title Company | |
| Dutra Alma M | -- | -- |
Source: Public Records
Mortgage History
| Date | Status | Borrower | Loan Amount |
|---|---|---|---|
| Open | Soin Tarun | $186,000 | |
| Open | Soin Tarun | $708,750 |
Source: Public Records
Tax History
| Year | Tax Paid | Tax Assessment Tax Assessment Total Assessment is a certain percentage of the fair market value that is determined by local assessors to be the total taxable value of land and additions on the property. | Land | Improvement |
|---|---|---|---|---|
| 2025 | $14,008 | $1,186,910 | $627,995 | $558,915 |
| 2024 | $14,008 | $1,163,644 | $615,685 | $547,959 |
| 2023 | $13,643 | $1,140,832 | $603,615 | $537,217 |
| 2022 | $13,481 | $1,118,464 | $591,780 | $526,684 |
| 2021 | $13,148 | $1,096,540 | $580,180 | $516,360 |
| 2020 | $13,228 | $1,085,304 | $574,235 | $511,069 |
| 2019 | $13,076 | $1,064,032 | $562,980 | $501,052 |
| 2018 | $12,824 | $1,043,176 | $551,945 | $491,231 |
| 2017 | $12,504 | $1,022,726 | $541,125 | $481,601 |
| 2016 | $12,300 | $1,002,673 | $530,515 | $472,158 |
| 2015 | $12,144 | $987,619 | $522,550 | $465,069 |
| 2014 | $11,942 | $968,275 | $512,315 | $455,960 |
Source: Public Records
Map
Nearby Homes
- 41670 Paseo Padre Pkwy
- 1416 Harrington St
- 41042 Ramon Terrace
- 2020 Briscoe Terrace
- 41016 Cornac Terrace
- 42077 Miranda St
- 1905 Lockwood Ave
- 706 Wisteria Dr
- 1672 Oro Dr
- 642 Fontes Dr
- 42329 Troyer Ave
- 41246 Mission Blvd
- 41392 Beatrice St
- 2244 Jackson St
- 41252 Mission Blvd
- 42170 Camino Santa Barbara
- 2839 Casita Terrace
- 42194 Camino Santa Barbara
- 2449 Washington Blvd
- 2813 Pinnacles Terrace
- 41536 Chiltern Dr
- 1070 Plymouth Ave
- 1086 Plymouth Ave
- 41521 Devon Ct
- 41632 Chiltern Dr
- 41519 Chiltern Dr
- 41529 Devon Ct
- 1208 Arnold Ct
- 1054 Plymouth Ave
- 41644 Chiltern Dr
- 1217 Arnold Ct
- 41631 Chiltern Dr
- 1216 Arnold Ct
- 41512 Chadbourne Dr
- 1071 Plymouth Ave
- 41530 Devon Ct
- 1079 Plymouth Ave
- 41488 Chiltern Dr
- 41522 Devon Ct
- 963 Plymouth Ave
Your Personal Tour Guide
Ask me questions while you tour the home.