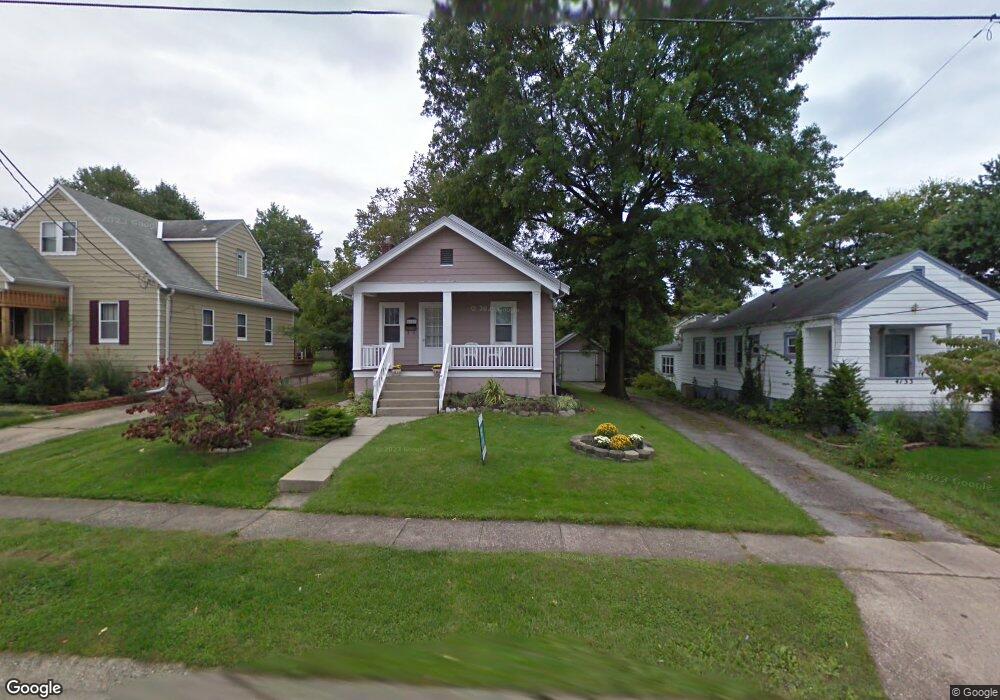
4153 O Leary Ave Cincinnati, OH 45236
Estimated Value: $157,091 - $205,000
1
Bed
1
Bath
575
Sq Ft
$298/Sq Ft
Est. Value
About This Home
This home is located at 4153 O Leary Ave, Cincinnati, OH 45236 and is currently estimated at $171,523, approximately $298 per square foot. 4153 O Leary Ave is a home located in Hamilton County with nearby schools including Amity Elementary School, Deer Park Jr/Sr High School, and Ohr Torah Cincinnati.
Ownership History
Date
Name
Owned For
Owner Type
Purchase Details
Closed on
Jul 26, 2011
Sold by
Burnett Jennifer A
Bought by
Carr Michael A
Current Estimated Value
Home Financials for this Owner
Home Financials are based on the most recent Mortgage that was taken out on this home.
Original Mortgage
$63,000
Outstanding Balance
$43,539
Interest Rate
4.53%
Mortgage Type
New Conventional
Estimated Equity
$127,984
Purchase Details
Closed on
May 5, 2010
Sold by
Zook Lawrence Annie M and Lawrence Patrick
Bought by
Alsip Joyce M
Purchase Details
Closed on
Sep 30, 2005
Sold by
Barnes Rebecca J Ramsey and Barnes Christopher Lee
Bought by
Zook Annie M
Home Financials for this Owner
Home Financials are based on the most recent Mortgage that was taken out on this home.
Original Mortgage
$71,120
Interest Rate
5.93%
Mortgage Type
Fannie Mae Freddie Mac
Create a Home Valuation Report for This Property
The Home Valuation Report is an in-depth analysis detailing your home's value as well as a comparison with similar homes in the area
Home Values in the Area
Average Home Value in this Area
Purchase History
| Date | Buyer | Sale Price | Title Company |
|---|---|---|---|
| Carr Michael A | $90,000 | Attorney | |
| Alsip Joyce M | $83,400 | Prodigy Title Agency | |
| Zook Annie M | $88,900 | None Available |
Source: Public Records
Mortgage History
| Date | Status | Borrower | Loan Amount |
|---|---|---|---|
| Open | Carr Michael A | $63,000 | |
| Previous Owner | Zook Annie M | $71,120 |
Source: Public Records
Tax History Compared to Growth
Tax History
| Year | Tax Paid | Tax Assessment Tax Assessment Total Assessment is a certain percentage of the fair market value that is determined by local assessors to be the total taxable value of land and additions on the property. | Land | Improvement |
|---|---|---|---|---|
| 2024 | $1,745 | $38,511 | $11,921 | $26,590 |
| 2023 | $1,828 | $38,511 | $11,921 | $26,590 |
| 2022 | $1,647 | $29,127 | $9,709 | $19,418 |
| 2021 | $1,600 | $29,127 | $9,709 | $19,418 |
| 2020 | $1,494 | $29,127 | $9,709 | $19,418 |
| 2019 | $1,441 | $26,481 | $8,827 | $17,654 |
| 2018 | $1,442 | $26,481 | $8,827 | $17,654 |
| 2017 | $1,365 | $26,481 | $8,827 | $17,654 |
| 2016 | $2,132 | $27,147 | $8,803 | $18,344 |
| 2015 | $1,948 | $27,147 | $8,803 | $18,344 |
| 2014 | $1,948 | $27,147 | $8,803 | $18,344 |
| 2013 | $2,119 | $29,190 | $9,464 | $19,726 |
Source: Public Records
Map
Nearby Homes
- 4106 Orchard Ln
- 7400 Plainfield Rd
- 4126 Orchard Ln
- 4040 Lansdowne Ave
- 4041 Lansdowne Ave
- 7610 Blue Ash Rd
- 7215 Maryland Ave
- 7237 Virginia Ave
- 7195 Maryland Ave
- 4279 Hegner Ave
- 4250 Schenck Ave
- 7833 Plainfield Rd
- 7723 Dearborn Ave
- 7820 Eustis Ct
- 3841 Thornton Dr
- 4351 Clifford Rd
- 4248 South Ave
- 4158 E Galbraith Rd
- 3816 Superior Ave
- 4039 E Galbraith Rd
- 4153 O'Leary Ave
- 4133 O'Leary Ave
- 4155 O Leary Ave
- 4133 O Leary Ave
- 4155 O'Leary Ave
- 4157 O Leary Ave
- 4131 O Leary Ave
- 4129 O'Leary Ave
- 4142 Lansdowne Ave
- 4159 O Leary Ave
- 4129 O Leary Ave
- 4140 Lansdowne Ave
- 4144 Lansdowne Ave
- 4144 O'Leary Ave
- 4138 Lansdowne Ave
- 4146 Lansdowne Ave
- 4144 O Leary Ave
- 4146 O'Leary Ave
- 4140 O Leary Ave
- 4146 O Leary Ave