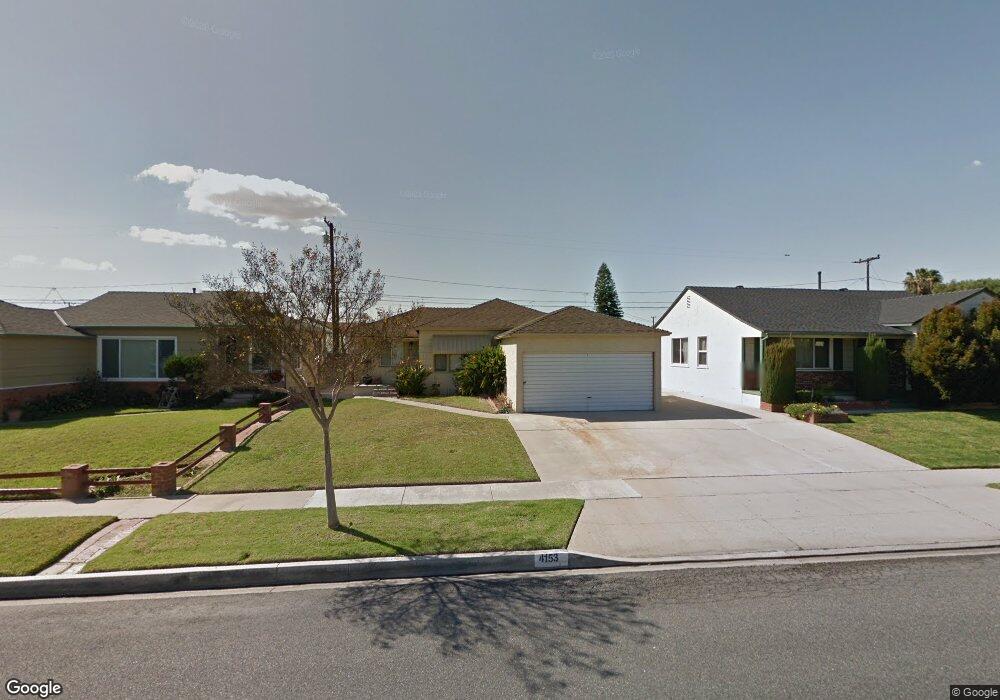
4153 Obispo Ave Lakewood, CA 90712
Lakewood Mutual NeighborhoodEstimated Value: $785,491 - $842,000
2
Beds
1
Bath
966
Sq Ft
$836/Sq Ft
Est. Value
About This Home
This home is located at 4153 Obispo Ave, Lakewood, CA 90712 and is currently estimated at $807,623, approximately $836 per square foot. 4153 Obispo Ave is a home located in Los Angeles County with nearby schools including James Madison Elementary School, Hoover Middle School, and Lakewood High School.
Ownership History
Date
Name
Owned For
Owner Type
Purchase Details
Closed on
Mar 2, 2018
Sold by
Harris Sarrah L
Bought by
Rodriguez Ramiro M
Current Estimated Value
Home Financials for this Owner
Home Financials are based on the most recent Mortgage that was taken out on this home.
Original Mortgage
$378,000
Outstanding Balance
$322,132
Interest Rate
4.15%
Mortgage Type
New Conventional
Estimated Equity
$485,491
Purchase Details
Closed on
Jun 29, 2011
Sold by
Nomberg Beverly Ann and The Robert Eugene Redner Livin
Bought by
Rodriguez Ramiro M and Harris Sarrah L
Home Financials for this Owner
Home Financials are based on the most recent Mortgage that was taken out on this home.
Original Mortgage
$311,888
Interest Rate
3.5%
Mortgage Type
FHA
Purchase Details
Closed on
May 16, 2002
Sold by
Redner Robert E
Bought by
Redner Robert Eugene and The Robert Eugene Redner Living Trust
Create a Home Valuation Report for This Property
The Home Valuation Report is an in-depth analysis detailing your home's value as well as a comparison with similar homes in the area
Home Values in the Area
Average Home Value in this Area
Purchase History
| Date | Buyer | Sale Price | Title Company |
|---|---|---|---|
| Rodriguez Ramiro M | -- | North American Title | |
| Rodriguez Ramiro M | $320,000 | North American Title Co | |
| Redner Robert Eugene | -- | -- |
Source: Public Records
Mortgage History
| Date | Status | Borrower | Loan Amount |
|---|---|---|---|
| Open | Rodriguez Ramiro M | $378,000 | |
| Previous Owner | Rodriguez Ramiro M | $311,888 |
Source: Public Records
Tax History Compared to Growth
Tax History
| Year | Tax Paid | Tax Assessment Tax Assessment Total Assessment is a certain percentage of the fair market value that is determined by local assessors to be the total taxable value of land and additions on the property. | Land | Improvement |
|---|---|---|---|---|
| 2025 | $5,460 | $401,926 | $321,543 | $80,383 |
| 2024 | $5,460 | $394,046 | $315,239 | $78,807 |
| 2023 | $5,368 | $386,320 | $309,058 | $77,262 |
| 2022 | $5,049 | $378,747 | $302,999 | $75,748 |
| 2021 | $4,949 | $371,321 | $297,058 | $74,263 |
| 2019 | $4,878 | $360,310 | $288,249 | $72,061 |
| 2018 | $4,702 | $353,247 | $282,598 | $70,649 |
| 2016 | $4,334 | $339,531 | $271,625 | $67,906 |
| 2015 | $4,166 | $334,431 | $267,545 | $66,886 |
| 2014 | $4,140 | $327,881 | $262,305 | $65,576 |
Source: Public Records
Map
Nearby Homes
- 4328 Deeboyar Ave
- 2729 Greentop St
- 2803 Frankel St
- 4559 Levelside Ave
- 3244 Centralia St
- 4155 Rose Ave
- 3829 Cherry Ave
- 4121 Country Club Dr
- 2912 Allred St
- 3746 Gardenia Ave
- 4700 Clair Del Ave Unit 538
- 3638 Sandwood St
- 2523 Allred St
- 4251 Gundry Ave
- 4520 Pepperwood Ave
- 2922 Eckleson St
- 4532 Pepperwood Ave
- 2912 Yearling St
- 3727 Walnut Ave
- 4196 4198 Del Mar Ave
- 4159 Obispo Ave
- 4149 Obispo Ave
- 4156 Brock Ave
- 4165 Obispo Ave
- 4143 Obispo Ave
- 4160 Brock Ave
- 4152 Brock Ave
- 4146 Brock Ave
- 4137 Obispo Ave
- 4169 Obispo Ave
- 4154 Obispo Ave
- 4148 Obispo Ave
- 2757 Greenmeadow Rd
- 4158 Obispo Ave
- 4144 Obispo Ave
- 4142 Brock Ave
- 4162 Obispo Ave
- 4133 Obispo Ave
- 4168 Obispo Ave
- 2834 Village Rd