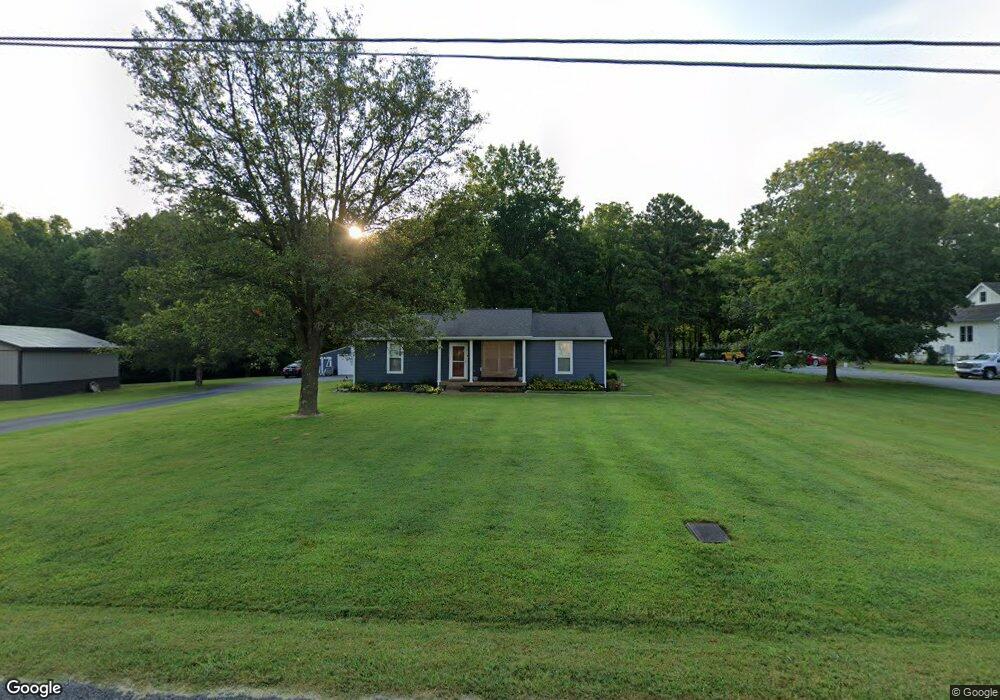
4154 Knipfer Rd Joelton, TN 37080
Joelton NeighborhoodEstimated Value: $306,070 - $454,000
3
Beds
2
Baths
1,152
Sq Ft
$326/Sq Ft
Est. Value
About This Home
This home is located at 4154 Knipfer Rd, Joelton, TN 37080 and is currently estimated at $375,268, approximately $325 per square foot. 4154 Knipfer Rd is a home located in Davidson County with nearby schools including Joelton Elementary School, Joelton Middle School, and Haynes Middle.
Ownership History
Date
Name
Owned For
Owner Type
Purchase Details
Closed on
Aug 28, 1998
Sold by
Milliken Rupert L and Milliken Nannie L
Bought by
Rogers Monty C and Bell Georgia C
Current Estimated Value
Home Financials for this Owner
Home Financials are based on the most recent Mortgage that was taken out on this home.
Original Mortgage
$100,307
Outstanding Balance
$19,910
Interest Rate
6.96%
Mortgage Type
FHA
Estimated Equity
$355,358
Purchase Details
Closed on
Dec 10, 1997
Sold by
Cunningham Jeffrey L
Bought by
Milliken Rupert L and Milliken Nannie L
Home Financials for this Owner
Home Financials are based on the most recent Mortgage that was taken out on this home.
Original Mortgage
$98,000
Interest Rate
7.19%
Mortgage Type
VA
Create a Home Valuation Report for This Property
The Home Valuation Report is an in-depth analysis detailing your home's value as well as a comparison with similar homes in the area
Home Values in the Area
Average Home Value in this Area
Purchase History
| Date | Buyer | Sale Price | Title Company |
|---|---|---|---|
| Rogers Monty C | $101,400 | -- | |
| Milliken Rupert L | $98,000 | -- |
Source: Public Records
Mortgage History
| Date | Status | Borrower | Loan Amount |
|---|---|---|---|
| Open | Rogers Monty C | $100,307 | |
| Previous Owner | Milliken Rupert L | $98,000 |
Source: Public Records
Tax History Compared to Growth
Tax History
| Year | Tax Paid | Tax Assessment Tax Assessment Total Assessment is a certain percentage of the fair market value that is determined by local assessors to be the total taxable value of land and additions on the property. | Land | Improvement |
|---|---|---|---|---|
| 2025 | $2,007 | $72,150 | $27,900 | $44,250 |
| 2024 | $1,340 | $45,875 | $15,300 | $30,575 |
| 2023 | $1,340 | $45,875 | $15,300 | $30,575 |
| 2022 | $1,340 | $45,875 | $15,300 | $30,575 |
| 2021 | $1,355 | $45,875 | $15,300 | $30,575 |
| 2020 | $1,377 | $36,350 | $11,050 | $25,300 |
| 2019 | $1,001 | $36,350 | $11,050 | $25,300 |
| 2018 | $751 | $36,350 | $11,050 | $25,300 |
| 2017 | $751 | $36,350 | $11,050 | $25,300 |
| 2016 | $1,301 | $33,150 | $12,250 | $20,900 |
| 2015 | $1,301 | $33,150 | $12,250 | $20,900 |
| 2014 | $1,301 | $33,150 | $12,250 | $20,900 |
Source: Public Records
Map
Nearby Homes
- 0 Clarksville Pike Unit RTC2777773
- 0 Clarksville Pike Unit RTC2777775
- 4222 Bernard Rd
- 5932 Clarksville Pike
- 4341 Bernard Rd
- 5843 Happy Hollow Ln
- 5776 Craft Rd
- 5145 Creasy Dr
- 3755 Bear Hollow Rd
- 6343 Clarksville Pike
- 3873 Cantarutti Rd
- 3828 Old Clarksville Pike
- 6421 Clarksville Pike
- 6220 Lake Rd
- 6016 Marrowbone Lake Rd
- 7181 Bidwell Rd
- 6365 Old Hickory Blvd
- 0 Whites Creek Pike
- 3651 Alessio Rd
- 6335 Old Hickory Blvd
- 4150 Knipfer Rd
- 4145 Knipfer Rd
- 4149 Knipfer Rd
- 4139 Knipfer Rd
- 4155 Knipfer Rd
- 4130 Knipfer Rd
- 4131 Knipfer Rd
- 4164 Knipfer Rd
- 4161 Knipfer Rd
- 4114 Knipfer Rd
- 4170 Knipfer Rd
- 4121 Knipfer Rd
- 4080 Bernard Rd
- 4070 Bernard Rd
- 4062 Bernard Rd
- 4182 Knipfer Rd
- 4171 Knipfer Rd
- 4100 Bernard Rd
- 4060 Bernard Rd
- 4108 Bernard Rd