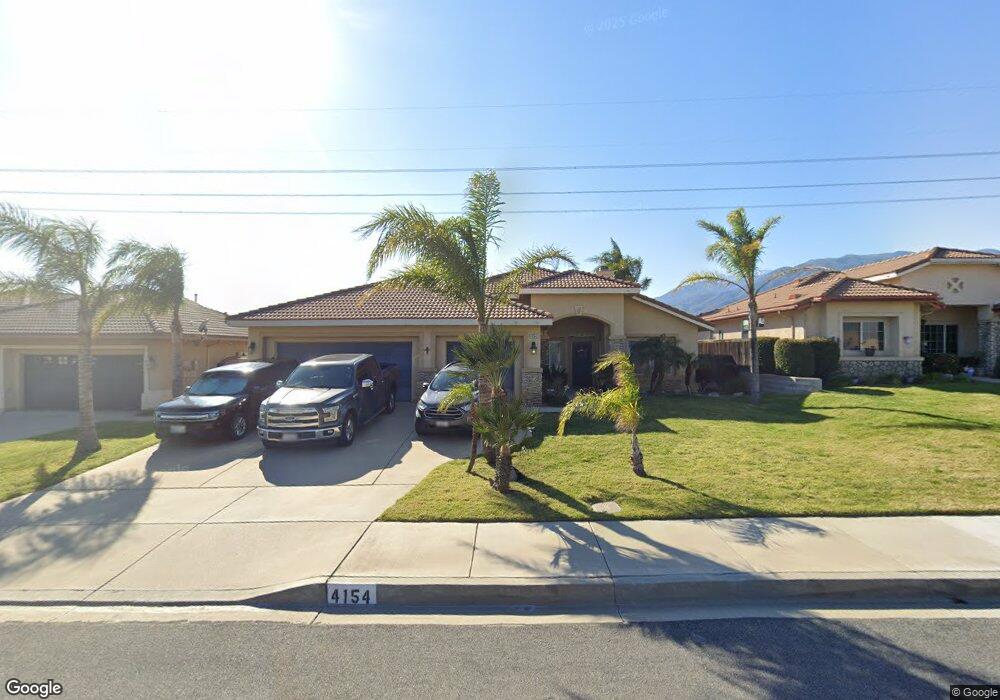
4154 N Flame Tree Ave Rialto, CA 92377
Estimated Value: $656,826 - $695,000
4
Beds
2
Baths
1,724
Sq Ft
$391/Sq Ft
Est. Value
About This Home
This home is located at 4154 N Flame Tree Ave, Rialto, CA 92377 and is currently estimated at $674,457, approximately $391 per square foot. 4154 N Flame Tree Ave is a home located in San Bernardino County with nearby schools including Nancy R. Kordyak Elementary School, Ethel Kucera Middle School, and Wilmer Amina Carter High School.
Ownership History
Date
Name
Owned For
Owner Type
Purchase Details
Closed on
May 28, 2015
Sold by
Rogina John R and Rogina Davey K
Bought by
Rogina John R
Current Estimated Value
Home Financials for this Owner
Home Financials are based on the most recent Mortgage that was taken out on this home.
Original Mortgage
$242,900
Outstanding Balance
$187,391
Interest Rate
3.64%
Mortgage Type
New Conventional
Estimated Equity
$487,066
Purchase Details
Closed on
Aug 21, 2002
Sold by
Oak Tree Industries Inc
Bought by
Rogina John R
Home Financials for this Owner
Home Financials are based on the most recent Mortgage that was taken out on this home.
Original Mortgage
$176,498
Interest Rate
5.99%
Mortgage Type
FHA
Purchase Details
Closed on
Aug 10, 2001
Sold by
Northpointe Rialto Lp
Bought by
Short Donald L and Short Deanna J
Create a Home Valuation Report for This Property
The Home Valuation Report is an in-depth analysis detailing your home's value as well as a comparison with similar homes in the area
Home Values in the Area
Average Home Value in this Area
Purchase History
| Date | Buyer | Sale Price | Title Company |
|---|---|---|---|
| Rogina John R | -- | Usa National Title Co | |
| Rogina John R | $188,000 | Lawyers Title Company | |
| Short Donald L | $333,929 | Lawyers Title Company |
Source: Public Records
Mortgage History
| Date | Status | Borrower | Loan Amount |
|---|---|---|---|
| Open | Rogina John R | $242,900 | |
| Previous Owner | Rogina John R | $176,498 |
Source: Public Records
Tax History Compared to Growth
Tax History
| Year | Tax Paid | Tax Assessment Tax Assessment Total Assessment is a certain percentage of the fair market value that is determined by local assessors to be the total taxable value of land and additions on the property. | Land | Improvement |
|---|---|---|---|---|
| 2025 | $3,735 | $272,288 | $68,073 | $204,215 |
| 2024 | $3,735 | $266,949 | $66,738 | $200,211 |
| 2023 | $3,954 | $261,714 | $65,429 | $196,285 |
| 2022 | $3,667 | $256,582 | $64,146 | $192,436 |
| 2021 | $3,646 | $251,551 | $62,888 | $188,663 |
| 2020 | $3,657 | $248,971 | $62,243 | $186,728 |
| 2019 | $3,582 | $244,090 | $61,023 | $183,067 |
| 2018 | $3,468 | $239,303 | $59,826 | $179,477 |
| 2017 | $3,464 | $234,611 | $58,653 | $175,958 |
| 2016 | $3,222 | $230,011 | $57,503 | $172,508 |
| 2015 | $3,379 | $226,556 | $56,639 | $169,917 |
| 2014 | $3,236 | $222,119 | $55,530 | $166,589 |
Source: Public Records
Map
Nearby Homes
- 17012 Hal Ln
- 17026 Schneider St
- 4788 Condor Ave
- 17921 Valerian Way
- 17961 Valerian Way
- 2768 W Buena Vista Dr
- 3648 Fawn Lily Ln
- 16560 Stone Pine Ln
- 16554 Stone Pine Ln
- 16548 Stone Pine Ln
- 16583 Bottlebrush Ln
- 16583 Bottlebrush Ln Unit 1
- 3762 Rosena Ranch Rd
- 16573 Bottlebrush Ln
- 16573 Bottlebrush Ln Unit 3
- 16540 Stone Pine Ln
- 16707 Island Oak St
- Plan 3 at The Arboretum - Trellis
- Plan 2 at The Arboretum - Trellis
- Plan 1 at The Arboretum - Trellis
- 4142 N Flame Tree Ave
- 4166 N Flame Tree Ave
- 4130 N Flame Tree Ave
- 4178 N Flame Tree Ave
- 4153 N Flame Tree Ave
- 4177 N Flame Tree Ave
- 4118 N Flame Tree Ave
- 4140 N Tangerine Dr
- 4128 N Tangerine Dr
- 4190 N Flame Tree Ave
- 4152 N Tangerine Dr
- 4106 N Flame Tree Ave
- 2862 W Sunnyview Dr
- 4094 N Flame Tree Ave
- 2850 W Sunnyview Dr
- 4137 N Tangerine Dr
- 4125 N Tangerine Dr
- 4349 Condor Ave
- 4103 N Tangerine Dr
- 4341 Condor Ave