
Seller's Agent in 2025
Anne Zacharias
Howard Hanna
(440) 315-9597
5 in this area
133 Total Sales
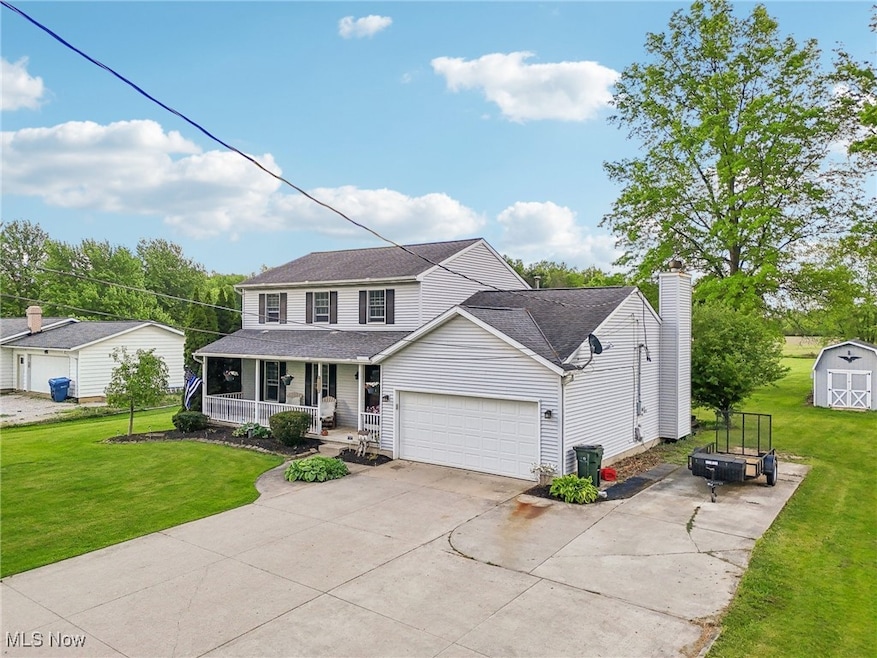
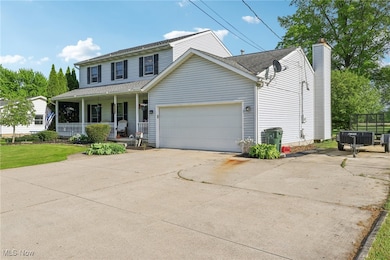
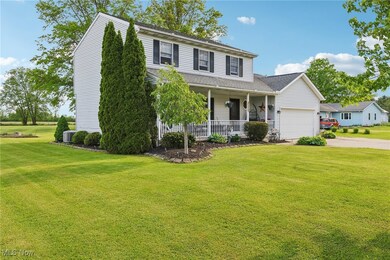
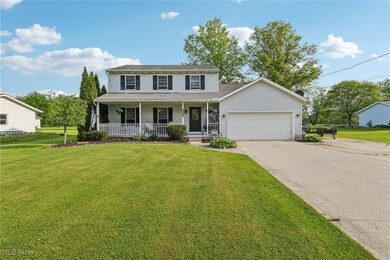
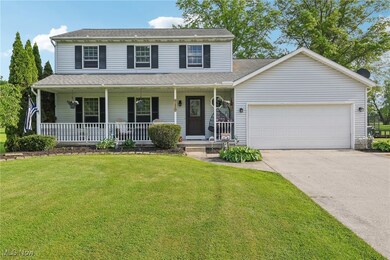
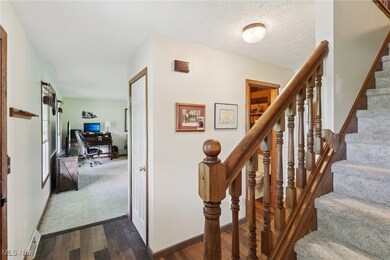
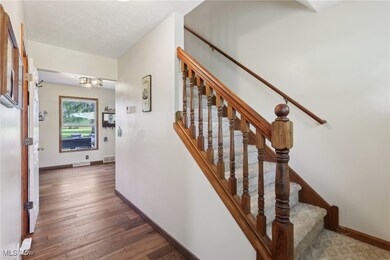
Warning; you may fall in love before you walk in the front door! This is it a meticulously maintained Colonial located in desirable LaGrange Township, served by Keystone Schools. Built in 2000, this one owner home offers a spacious 1,750 sq ft. With 3 bedrooms, 2 full bathrooms, and a half bath on the main level, perfect for family living and entertaining. Enjoy peace of mind with major recent updates, including a newer furnace and A/C (2024) and a newer hot water tank (2024) we also can’t forget about the newer roof (2018). The remodeled kitchen boasts granite countertops, a stylish tile backsplash, and updated cabinetry — ideal for the modern chef. Newer real hardwood floors add warmth and elegance throughout the main living area. Upstairs, you’ll find all three generously sized bedrooms, including the home’s first full bathroom conveniently located off the hallway. The primary suite features its own private full bathroom and a spacious walk-in closet, offering both comfort and convenience. This well-loved home is ready for its next chapter- don’t let this opportunity slip away from you!
Last Agent to Sell the Property
Howard Hanna Brokerage Email: annezacharias@howardhanna.com, 440-315-9597 License #2014004252 Listed on: 05/15/2025
| Date | Type | Sale Price | Title Company |
|---|---|---|---|
| Warranty Deed | $360,100 | Chicago Title | |
| Interfamily Deed Transfer | -- | None Available | |
| Interfamily Deed Transfer | -- | None Available | |
| Interfamily Deed Transfer | -- | None Available |
| Date | Status | Loan Amount | Loan Type |
|---|---|---|---|
| Open | $306,008 | New Conventional |
| Date | Event | Price | List to Sale | Price per Sq Ft |
|---|---|---|---|---|
| 07/21/2025 07/21/25 | Sold | $360,010 | -2.7% | $206 / Sq Ft |
| 07/03/2025 07/03/25 | For Sale | $369,999 | +2.8% | $211 / Sq Ft |
| 07/02/2025 07/02/25 | Off Market | $360,010 | -- | -- |
| 06/09/2025 06/09/25 | Price Changed | $369,999 | -5.1% | $211 / Sq Ft |
| 06/03/2025 06/03/25 | Price Changed | $389,900 | -2.5% | $223 / Sq Ft |
| 05/15/2025 05/15/25 | For Sale | $399,900 | -- | $229 / Sq Ft |
| Year | Tax Paid | Tax Assessment Tax Assessment Total Assessment is a certain percentage of the fair market value that is determined by local assessors to be the total taxable value of land and additions on the property. | Land | Improvement |
|---|---|---|---|---|
| 2024 | $3,763 | $91,791 | $18,977 | $72,814 |
| 2023 | $3,727 | $76,129 | $18,389 | $57,740 |
| 2022 | $3,699 | $76,129 | $18,389 | $57,740 |
| 2021 | $3,700 | $76,129 | $18,389 | $57,740 |
| 2020 | $3,273 | $59,990 | $14,490 | $45,500 |
| 2019 | $3,252 | $59,990 | $14,490 | $45,500 |
| 2018 | $3,238 | $59,990 | $14,490 | $45,500 |
| 2017 | $3,305 | $58,600 | $15,360 | $43,240 |
| 2016 | $3,281 | $58,600 | $15,360 | $43,240 |
| 2015 | $3,275 | $58,600 | $15,360 | $43,240 |
| 2014 | $2,696 | $55,290 | $14,490 | $40,800 |
| 2013 | $2,612 | $55,290 | $14,490 | $40,800 |
Seller's Agent in 2025
Anne Zacharias
Howard Hanna
(440) 315-9597
5 in this area
133 Total Sales
Buyer's Agent in 2025
Carol Herzing
Russell Real Estate Services
(440) 759-3347
1 in this area
77 Total Sales
Source: MLS Now (Howard Hanna)
MLS Number: 5123006
APN: 15-00-004-000-015
Disclaimer: Certain information contained herein is derived from information provided by parties other than Homes.com. All information provided is deemed reliable, but is not guaranteed to be accurate and should be independently verified.
![]() Certain information contained herein is derived from information provided by parties other than Homes.com. All information provided is deemed reliable, but is not guaranteed to be accurate and should be independently verified.
Certain information contained herein is derived from information provided by parties other than Homes.com. All information provided is deemed reliable, but is not guaranteed to be accurate and should be independently verified.
Ask me questions while you tour the home.