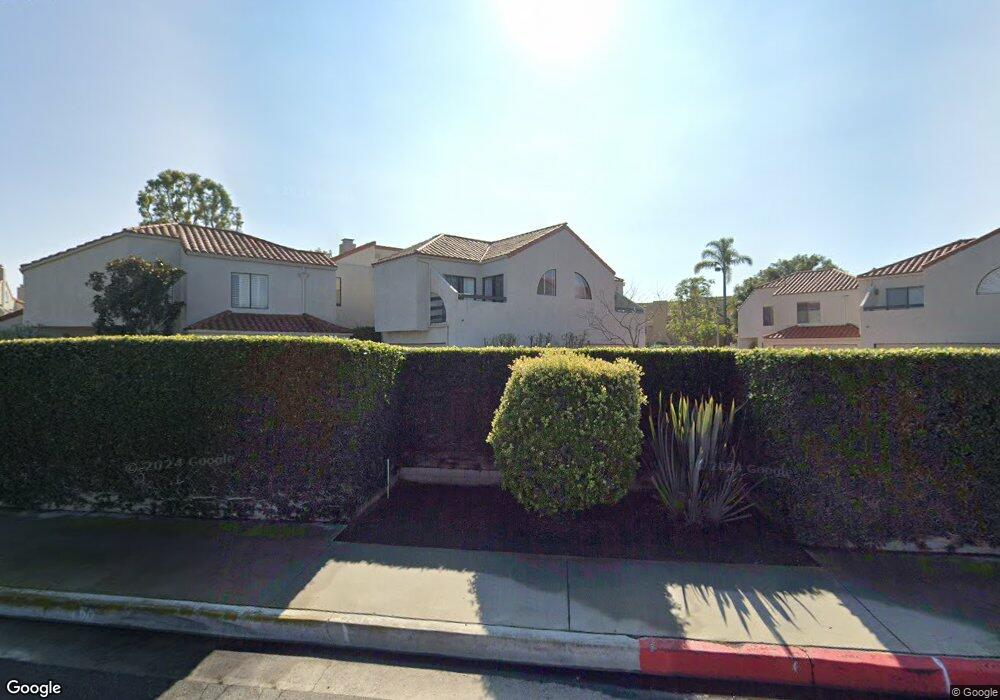
4156 Delphi Cir Huntington Beach, CA 92649
Huntington Harbour NeighborhoodEstimated Value: $1,141,000 - $1,378,000
3
Beds
3
Baths
1,913
Sq Ft
$657/Sq Ft
Est. Value
About This Home
This home is located at 4156 Delphi Cir, Huntington Beach, CA 92649 and is currently estimated at $1,256,503, approximately $656 per square foot. 4156 Delphi Cir is a home located in Orange County with nearby schools including Harbour View Elementary School, Marine View Middle, and Marina High School.
Ownership History
Date
Name
Owned For
Owner Type
Purchase Details
Closed on
Sep 30, 2011
Sold by
Rietdyk Tony A and Riedyk Becky
Bought by
Rietdyk Tony Adrian and Rietdyk Rebecca Louise
Current Estimated Value
Home Financials for this Owner
Home Financials are based on the most recent Mortgage that was taken out on this home.
Original Mortgage
$262,500
Interest Rate
4.09%
Mortgage Type
New Conventional
Purchase Details
Closed on
Aug 14, 2011
Sold by
Rietdyk Tony A and Rietdyk Becky
Bought by
Rietdyk Tony Adrian and Rietdyk Rebecca Louise
Home Financials for this Owner
Home Financials are based on the most recent Mortgage that was taken out on this home.
Original Mortgage
$262,500
Interest Rate
4.09%
Mortgage Type
New Conventional
Create a Home Valuation Report for This Property
The Home Valuation Report is an in-depth analysis detailing your home's value as well as a comparison with similar homes in the area
Home Values in the Area
Average Home Value in this Area
Purchase History
| Date | Buyer | Sale Price | Title Company |
|---|---|---|---|
| Rietdyk Tony Adrian | -- | Accommodation | |
| Rietdyk Tony A | -- | Usa National Title Co | |
| Rietdyk Tony Adrian | -- | None Available |
Source: Public Records
Mortgage History
| Date | Status | Borrower | Loan Amount |
|---|---|---|---|
| Closed | Rietdyk Tony A | $262,500 |
Source: Public Records
Tax History Compared to Growth
Tax History
| Year | Tax Paid | Tax Assessment Tax Assessment Total Assessment is a certain percentage of the fair market value that is determined by local assessors to be the total taxable value of land and additions on the property. | Land | Improvement |
|---|---|---|---|---|
| 2025 | $6,318 | $551,928 | $329,845 | $222,083 |
| 2024 | $6,318 | $541,106 | $323,377 | $217,729 |
| 2023 | $6,174 | $530,497 | $317,037 | $213,460 |
| 2022 | $6,084 | $520,096 | $310,821 | $209,275 |
| 2021 | $5,973 | $509,899 | $304,727 | $205,172 |
| 2020 | $5,906 | $504,671 | $301,602 | $203,069 |
| 2019 | $5,805 | $494,776 | $295,688 | $199,088 |
| 2018 | $5,675 | $485,075 | $289,890 | $195,185 |
| 2017 | $5,586 | $475,564 | $284,206 | $191,358 |
| 2016 | $5,358 | $466,240 | $278,634 | $187,606 |
| 2015 | $5,277 | $459,237 | $274,449 | $184,788 |
| 2014 | $5,174 | $450,242 | $269,073 | $181,169 |
Source: Public Records
Map
Nearby Homes
- 4179 Andros Cir
- 16083 Crete Ln
- 16181 Santa Barbara Ln
- 16125 Warmington Ln Unit 12
- 4458 Alderport Dr Unit 59
- 16222 Monterey Ln Unit 79
- 16222 Monterey Ln Unit 367
- 16222 Monterey Ln Unit 210
- 16222 Monterey Ln Unit 19
- 16222 Monterey Ln
- 16222 Monterey Ln Unit 155
- 16222 Monterey Ln Unit 164
- 16222 Monterey Ln Unit 285
- 16222 Monterey Ln Unit 327
- 16222 Monterey Ln Unit 84
- 16222 Monterey Ln Unit 379
- 3842 Montego Dr
- 16214 Bimini Ln
- 16449 Wimbledon Ln
- 16103 Saint Croix Cir
- 4162 Delphi Cir
- 4150 Delphi Cir
- 4168 Delphi Cir
- 4138 Delphi Cir
- 4132 Delphi Cir
- 4161 Andros Cir
- 4126 Delphi Cir
- 4167 Andros Cir
- 4120 Delphi Cir
- 4173 Andros Cir
- 4111 Shorebreak Dr
- 4121 Shorebreak Dr
- 4101 Shorebreak Dr
- 4194 Delphi Cir
- 4110 Delphi Cir
- 4091 Shorebreak Dr
- 4104 Delphi Cir
- 4131 Shorebreak Dr
- 4185 Andros Cir