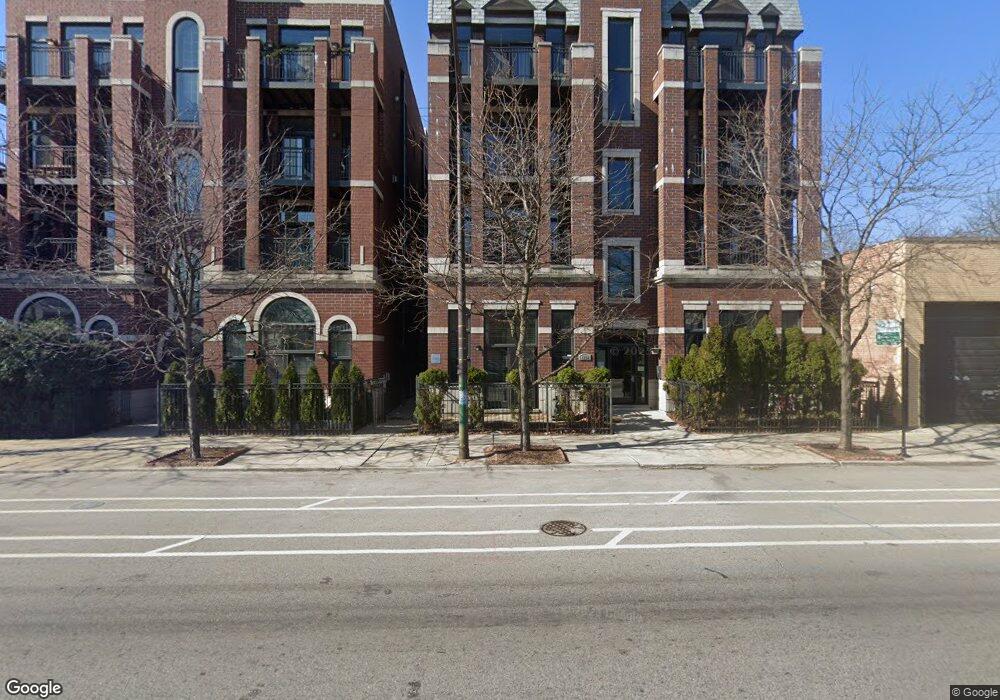
4156 N Elston Ave Unit 3N Chicago, IL 60618
Irving Park NeighborhoodEstimated Value: $382,000 - $449,000
3
Beds
2
Baths
1,467
Sq Ft
$290/Sq Ft
Est. Value
About This Home
This home is located at 4156 N Elston Ave Unit 3N, Chicago, IL 60618 and is currently estimated at $424,958, approximately $289 per square foot. 4156 N Elston Ave Unit 3N is a home located in Cook County with nearby schools including Belding Elementary School, Schurz High School, and Gateway Montessori School.
Ownership History
Date
Name
Owned For
Owner Type
Purchase Details
Closed on
Jun 19, 2023
Sold by
Lapetino Tim E and Lapetino Emily A
Bought by
Celeste Manoucheka
Current Estimated Value
Home Financials for this Owner
Home Financials are based on the most recent Mortgage that was taken out on this home.
Original Mortgage
$331,890
Outstanding Balance
$322,999
Interest Rate
6.38%
Mortgage Type
New Conventional
Estimated Equity
$101,959
Purchase Details
Closed on
May 26, 2016
Sold by
Joiner Andrew J
Bought by
Lapetino Frank and Lapetino Jackie M
Home Financials for this Owner
Home Financials are based on the most recent Mortgage that was taken out on this home.
Original Mortgage
$260,000
Interest Rate
3.87%
Mortgage Type
New Conventional
Purchase Details
Closed on
Jun 19, 2009
Sold by
4156 North Elston Avenue Llc
Bought by
Joiner Andrew J
Home Financials for this Owner
Home Financials are based on the most recent Mortgage that was taken out on this home.
Original Mortgage
$226,875
Interest Rate
3.75%
Mortgage Type
Purchase Money Mortgage
Create a Home Valuation Report for This Property
The Home Valuation Report is an in-depth analysis detailing your home's value as well as a comparison with similar homes in the area
Home Values in the Area
Average Home Value in this Area
Purchase History
| Date | Buyer | Sale Price | Title Company |
|---|---|---|---|
| Celeste Manoucheka | $390,000 | Burnet Title | |
| Lapetino Frank | $325,000 | Chicago Title Company | |
| Joiner Andrew J | $302,500 | Alliance Title Corporation |
Source: Public Records
Mortgage History
| Date | Status | Borrower | Loan Amount |
|---|---|---|---|
| Open | Celeste Manoucheka | $331,890 | |
| Previous Owner | Lapetino Frank | $260,000 | |
| Previous Owner | Joiner Andrew J | $226,875 |
Source: Public Records
Tax History Compared to Growth
Tax History
| Year | Tax Paid | Tax Assessment Tax Assessment Total Assessment is a certain percentage of the fair market value that is determined by local assessors to be the total taxable value of land and additions on the property. | Land | Improvement |
|---|---|---|---|---|
| 2024 | $6,285 | $35,337 | $4,068 | $31,269 |
| 2023 | $6,105 | $33,000 | $3,281 | $29,719 |
| 2022 | $6,105 | $33,000 | $3,281 | $29,719 |
| 2021 | $6,658 | $32,999 | $3,280 | $29,719 |
| 2020 | $5,750 | $25,724 | $1,443 | $24,281 |
| 2019 | $5,774 | $28,644 | $1,443 | $27,201 |
| 2018 | $5,677 | $28,644 | $1,443 | $27,201 |
| 2017 | $5,037 | $23,321 | $1,312 | $22,009 |
| 2016 | $4,687 | $23,321 | $1,312 | $22,009 |
| 2015 | $4,288 | $23,321 | $1,312 | $22,009 |
| 2014 | $3,437 | $18,456 | $3,690 | $14,766 |
| 2013 | $3,369 | $18,456 | $3,690 | $14,766 |
Source: Public Records
Map
Nearby Homes
- 4207 N Avers Ave
- 4115 N Ridgeway Ave
- 4103 N Lawndale Ave Unit 202
- 3707 W Cullom Ave Unit 1
- 4135 N Monticello Ave
- 3614 W Irving Park Rd
- 3558 W Belle Plaine Ave Unit 3
- 3551 W Belle Plaine Ave Unit 2
- 4239 N Keystone Ave Unit 3S
- 4110 N Keystone Ave Unit 1N
- 4243 N Keystone Ave Unit GN
- 3816 W Montrose Ave
- 3826 N Hamlin Ave
- 4203 N Drake Ave
- 4207 N Drake Ave
- 3611 W Montrose Ave Unit 405
- 4146 N Kedvale Ave Unit 1C
- 4126 N Kedvale Ave Unit 302
- 4387 N Elston Ave
- 4317 N Kedvale Ave
- 4156 N Elston Ave Unit 4S
- 4156 N Elston Ave Unit G1
- 4156 N Elston Ave Unit 1S
- 4156 N Elston Ave Unit 4N
- 4156 N Elston Ave Unit 2S
- 4156 N Elston Ave Unit 1N
- 4156 N Elston Ave Unit G2
- 4156 N Elston Ave Unit G3
- 4156 N Elston Ave Unit 3S
- 4156 N Elston Ave Unit 3S
- 4156 N Elston Ave Unit 1N
- 4156 N Elston Ave Unit 4S
- 4156 N Elston Ave Unit 4N
- 4156 N Elston Ave Unit 2N
- 4156 N Elston Ave Unit 3N
- 4156 N Elston Ave Unit 2S
- 4156 N Elston Ave Unit 1S
- 4152 N Elston Ave Unit G3
- 4152 N Elston Ave Unit G1
- 4152 N Elston Ave Unit 4S