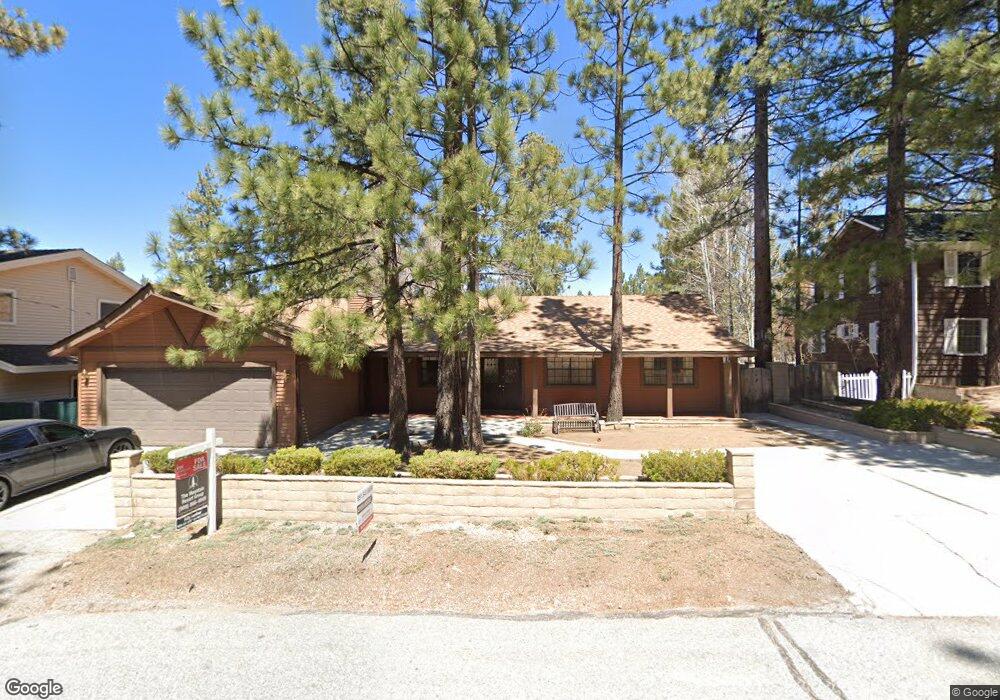
41564 Mockingbird Ln Big Bear, CA 92315
Estimated Value: $649,000 - $742,000
3
Beds
2
Baths
2,222
Sq Ft
$320/Sq Ft
Est. Value
About This Home
This home is located at 41564 Mockingbird Ln, Big Bear, CA 92315 and is currently estimated at $710,445, approximately $319 per square foot. 41564 Mockingbird Ln is a home located in San Bernardino County with nearby schools including Big Bear Middle School, Big Bear High School, and Calvary Chapel Big Bear Christian School.
Ownership History
Date
Name
Owned For
Owner Type
Purchase Details
Closed on
Jan 7, 2025
Sold by
Danny And Babette Anderson Revocable Tru and Anderson Babette
Bought by
Karraker Skyla Grace
Current Estimated Value
Purchase Details
Closed on
Mar 8, 2021
Sold by
Anderson Babette L and Anderson Danny R
Bought by
Anderson Babette and Anderson Danny
Purchase Details
Closed on
Oct 3, 2013
Sold by
Anderson Babette L
Bought by
Anderson Babette L and Anderson Danny R
Purchase Details
Closed on
Sep 10, 2012
Sold by
Kelley Mary K
Bought by
Anderson Babette L
Purchase Details
Closed on
Sep 1, 1998
Sold by
Ray Pleze W
Bought by
Ray Pleze W
Purchase Details
Closed on
May 16, 1994
Sold by
Ray Joyce L
Bought by
Ray Pleze W
Create a Home Valuation Report for This Property
The Home Valuation Report is an in-depth analysis detailing your home's value as well as a comparison with similar homes in the area
Home Values in the Area
Average Home Value in this Area
Purchase History
| Date | Buyer | Sale Price | Title Company |
|---|---|---|---|
| Karraker Skyla Grace | $682,000 | Chicago Title | |
| Karraker Skyla Grace | -- | Chicago Title | |
| Karraker Skyla Grace | $682,000 | Chicago Title | |
| Anderson Babette | -- | None Available | |
| Anderson Babette L | -- | None Available | |
| Anderson Babette L | -- | None Available | |
| Ray Pleze W | -- | -- | |
| Ray Pleze W | -- | -- |
Source: Public Records
Tax History
| Year | Tax Paid | Tax Assessment Tax Assessment Total Assessment is a certain percentage of the fair market value that is determined by local assessors to be the total taxable value of land and additions on the property. | Land | Improvement |
|---|---|---|---|---|
| 2025 | $5,041 | $350,956 | $92,357 | $258,599 |
| 2024 | $4,871 | $344,074 | $90,546 | $253,528 |
| 2023 | $4,709 | $337,328 | $88,771 | $248,557 |
| 2022 | $4,505 | $330,713 | $87,030 | $243,683 |
| 2021 | $4,376 | $324,229 | $85,324 | $238,905 |
| 2020 | $4,426 | $320,904 | $84,449 | $236,455 |
| 2019 | $4,321 | $314,612 | $82,793 | $231,819 |
| 2018 | $4,178 | $308,444 | $81,170 | $227,274 |
| 2017 | $4,072 | $302,396 | $79,578 | $222,818 |
| 2016 | $3,984 | $296,467 | $78,018 | $218,449 |
| 2015 | $3,951 | $292,014 | $76,846 | $215,168 |
| 2014 | $3,883 | $286,294 | $75,341 | $210,953 |
Source: Public Records
Map
Nearby Homes
- 41537 Mockingbird Dr
- 41604 Hummingbird Ln
- 41640 Mockingbird Dr
- 41659 Mockingbird Dr
- 0 Tahoe Dr
- 455 Crane Dr
- 437 Chickadee Dr
- 41591 Tahoe Dr
- 41385 Eastwood Rd
- 545 545 Wren Dr
- 216 Alp Ct
- 433 Conklin Rd
- 475 Thrush Dr Unit 15
- 475 Thrush Dr Unit 13
- 475 Thrush Dr Unit 67
- 475 Thrush Dr Unit 13
- 0 Marina Point Dr
- 568 Wren Dr
- 41307 Park Ave
- 450 Georgia St
- 41564 Mockingbird Dr
- 41576 Mockingbird Dr
- 41586 Mockingbird Dr
- 41549 Mockingbird Dr
- 41559 Mockingbird Dr
- 41571 Mockingbird Dr
- 269 Bluebird Ct
- 41605 Hummingbird Ln
- 266 Bluebird Ct
- 278 Bluebird Ct
- 41581 Mockingbird Dr
- 41598 Mockingbird Dr
- 268 Bluebird Ct
- 41583 Swan Dr
- 41569 Swan Dr
- 41608 Hummingbird Ln
- 41595 Mockingbird Dr
- 41562 Park Ave
- 41557 Swan Dr
- 41550 Park Ave
Your Personal Tour Guide
Ask me questions while you tour the home.