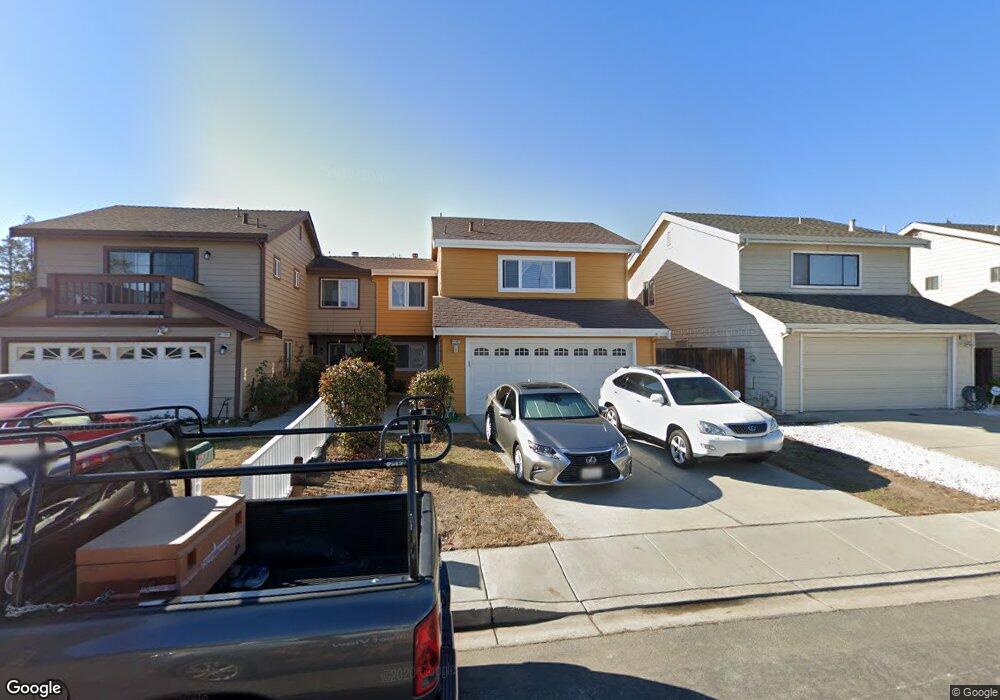
41567 Hooper St Fremont, CA 94538
Irvington NeighborhoodEstimated Value: $1,314,000 - $1,433,000
3
Beds
3
Baths
1,354
Sq Ft
$1,003/Sq Ft
Est. Value
About This Home
This home is located at 41567 Hooper St, Fremont, CA 94538 and is currently estimated at $1,357,679, approximately $1,002 per square foot. 41567 Hooper St is a home located in Alameda County with nearby schools including O. N. Hirsch Elementary School, John M. Horner Junior High School, and Irvington High School.
Ownership History
Date
Name
Owned For
Owner Type
Purchase Details
Closed on
Sep 4, 2007
Sold by
Lee Diana M and Wong Dale Seeto
Bought by
Lee Jack and Chan Yik Tung
Current Estimated Value
Home Financials for this Owner
Home Financials are based on the most recent Mortgage that was taken out on this home.
Original Mortgage
$417,000
Outstanding Balance
$265,366
Interest Rate
6.67%
Mortgage Type
Purchase Money Mortgage
Estimated Equity
$1,092,313
Create a Home Valuation Report for This Property
The Home Valuation Report is an in-depth analysis detailing your home's value as well as a comparison with similar homes in the area
Home Values in the Area
Average Home Value in this Area
Purchase History
| Date | Buyer | Sale Price | Title Company |
|---|---|---|---|
| Lee Jack | $540,000 | Fidelity National Title Co |
Source: Public Records
Mortgage History
| Date | Status | Borrower | Loan Amount |
|---|---|---|---|
| Open | Lee Jack | $417,000 |
Source: Public Records
Tax History Compared to Growth
Tax History
| Year | Tax Paid | Tax Assessment Tax Assessment Total Assessment is a certain percentage of the fair market value that is determined by local assessors to be the total taxable value of land and additions on the property. | Land | Improvement |
|---|---|---|---|---|
| 2025 | $8,624 | $702,251 | $212,775 | $496,476 |
| 2024 | $8,624 | $688,347 | $208,604 | $486,743 |
| 2023 | $8,389 | $681,717 | $204,515 | $477,202 |
| 2022 | $8,274 | $661,351 | $200,505 | $467,846 |
| 2021 | $8,072 | $648,251 | $196,575 | $458,676 |
| 2020 | $8,077 | $648,534 | $194,560 | $453,974 |
| 2019 | $7,985 | $635,822 | $190,746 | $445,076 |
| 2018 | $7,828 | $623,358 | $187,007 | $436,351 |
| 2017 | $7,631 | $611,138 | $183,341 | $427,797 |
| 2016 | $7,498 | $599,156 | $179,747 | $419,409 |
| 2015 | $7,396 | $590,160 | $177,048 | $413,112 |
| 2014 | $7,266 | $578,604 | $173,581 | $405,023 |
Source: Public Records
Map
Nearby Homes
- 3923 Wildflower Common Unit 19
- 3918 Fossano Common
- 3872 Wildflower Common Unit 27
- 3800 Adams Ave
- 41212 Fremont Blvd
- 41882 Gifford St
- 4309 Bora Ave
- 42759 Newport Dr
- 4463 Hyde Common Unit 306
- 4310 Providence Terrace
- 42747 Wixon Dr
- 4533 Capewood Terrace
- 4214 Providence Terrace
- 4537 Capewood Terrace
- 41538 Casabella Common
- 3331 Union St
- 40769 Squill Common
- 40708 Fremont Blvd
- 42932 Peachwood St
- 40696 Robin St
- 41553 Hooper St
- 41581 Hooper St
- 41539 Hooper St
- 41529 Hooper St
- 41564 Hooper St
- 41550 Hooper St
- 41578 Hooper St
- 41536 Hooper St
- 41522 Hooper St
- 3948 Scamman Ct
- 4016 Carol Ave
- 4012 Carol Ave
- 3934 Scamman Ct
- 3899 Scamman Ct
- 3978 Fossano Common
- 4008 Carol Ave
- 3988 Fossano Common
- 4005 Penny Terrace
- 3968 Fossano Common
- 3998 Fossano Common
