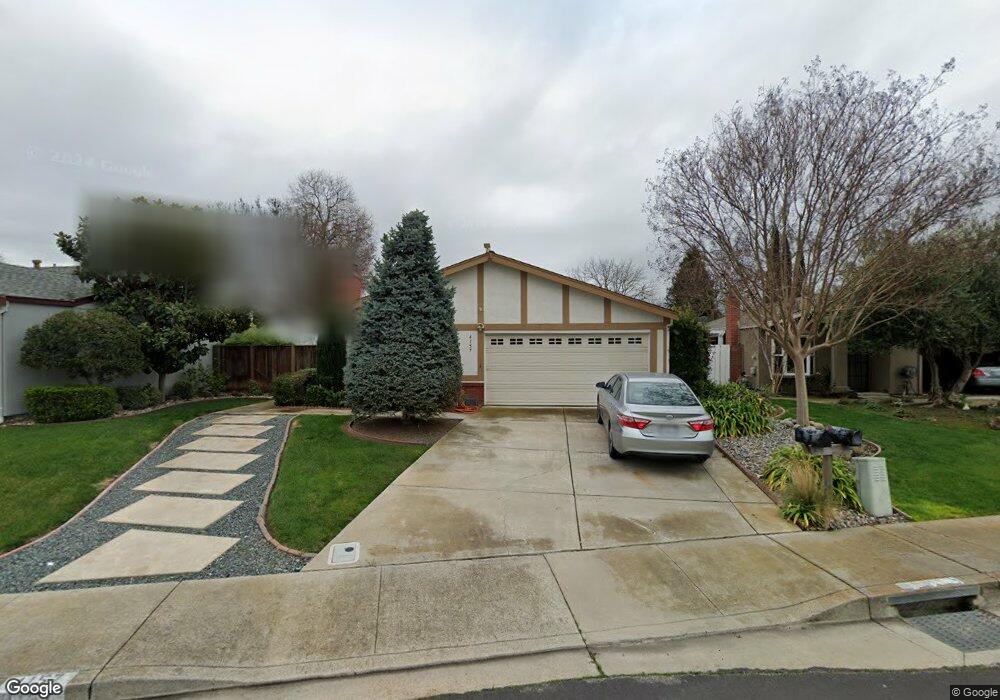
4157 Bristlecone Way Livermore, CA 94551
Springtown NeighborhoodEstimated Value: $863,740 - $958,000
3
Beds
2
Baths
1,110
Sq Ft
$815/Sq Ft
Est. Value
About This Home
This home is located at 4157 Bristlecone Way, Livermore, CA 94551 and is currently estimated at $904,685, approximately $815 per square foot. 4157 Bristlecone Way is a home located in Alameda County with nearby schools including Altamont Creek Elementary School, Andrew N. Christensen Middle School, and Livermore High School.
Ownership History
Date
Name
Owned For
Owner Type
Purchase Details
Closed on
Dec 14, 2012
Sold by
Meiers Matthew
Bought by
Bankhead Meiers Debbie
Current Estimated Value
Purchase Details
Closed on
Feb 24, 2003
Sold by
Thalhuber Steven Charles and Ling Rebecca Wanxuan
Bought by
Thalhuber Steven Charles and Ling Rebecca Wanxuan
Home Financials for this Owner
Home Financials are based on the most recent Mortgage that was taken out on this home.
Original Mortgage
$172,000
Interest Rate
5.93%
Purchase Details
Closed on
Jul 9, 1999
Sold by
Anderson Ross A and Anderson Teri A
Bought by
Thalhuber Steven Charles and Thalhuber Natha
Home Financials for this Owner
Home Financials are based on the most recent Mortgage that was taken out on this home.
Original Mortgage
$178,800
Interest Rate
7.12%
Create a Home Valuation Report for This Property
The Home Valuation Report is an in-depth analysis detailing your home's value as well as a comparison with similar homes in the area
Home Values in the Area
Average Home Value in this Area
Purchase History
| Date | Buyer | Sale Price | Title Company |
|---|---|---|---|
| Bankhead Meiers Debbie | -- | Old Republic Title Company | |
| Bankhead Tammy | $384,000 | Old Republic Title Company | |
| Thalhuber Steven Charles | -- | Fidelity National Title Co | |
| Thalhuber Steven Charles | $238,500 | Placer Title Company |
Source: Public Records
Mortgage History
| Date | Status | Borrower | Loan Amount |
|---|---|---|---|
| Previous Owner | Thalhuber Steven Charles | $172,000 | |
| Previous Owner | Thalhuber Steven Charles | $178,800 |
Source: Public Records
Tax History Compared to Growth
Tax History
| Year | Tax Paid | Tax Assessment Tax Assessment Total Assessment is a certain percentage of the fair market value that is determined by local assessors to be the total taxable value of land and additions on the property. | Land | Improvement |
|---|---|---|---|---|
| 2025 | $6,409 | $472,848 | $141,854 | $330,994 |
| 2024 | $6,409 | $463,580 | $139,074 | $324,506 |
| 2023 | $6,306 | $454,490 | $136,347 | $318,143 |
| 2022 | $6,208 | $445,581 | $133,674 | $311,907 |
| 2021 | $6,077 | $436,845 | $131,053 | $305,792 |
| 2020 | $5,893 | $432,368 | $129,710 | $302,658 |
| 2019 | $5,912 | $423,893 | $127,168 | $296,725 |
| 2018 | $5,780 | $415,583 | $124,675 | $290,908 |
| 2017 | $5,627 | $407,434 | $122,230 | $285,204 |
| 2016 | $5,411 | $399,447 | $119,834 | $279,613 |
| 2015 | $5,083 | $393,450 | $118,035 | $275,415 |
| 2014 | $4,993 | $385,743 | $115,723 | $270,020 |
Source: Public Records
Map
Nearby Homes
- 1981 Monterey Dr
- 2035 Monterey Dr
- 1479 Spring Valley Common
- 2013 Galloway Common
- 4172 Galloway St
- 4754 Zinnia Ct
- 1817 Bluebell Dr
- 5179 Crocus Way
- 1048 Spring Valley Common
- 1031 Spring Valley Common
- 1370 Daisy Ln
- 814 Sundial Cir Unit 105
- 5182 Sunburst Ln
- 5445 Treeflower Dr
- 734 Bellflower St
- 5315 Rainflower Dr
- 5473 Rainflower Dr
- 5749 Cherry Way
- 4355 Raymond Rd
- 635 Eliot Dr
- 4163 Bristlecone Way
- 4145 Bristlecone Way
- 4131 Bristlecone Way
- 4162 Bishop Pine Way
- 4168 Bishop Pine Way
- 4179 Bristlecone Way
- 4176 Bishop Pine Way
- 4150 Bishop Pine Way
- 4123 Bristlecone Way
- 4187 Bristlecone Way
- 4152 Bristlecone Way
- 4148 Bristlecone Way
- 4130 Bristlecone Way
- 4180 Bishop Pine Way
- 4144 Bishop Pine Way
- 4166 Bristlecone Way
- 4122 Bristlecone Way
- 4117 Bristlecone Way
- 4138 Bishop Pine Way
- 4191 Bristlecone Way