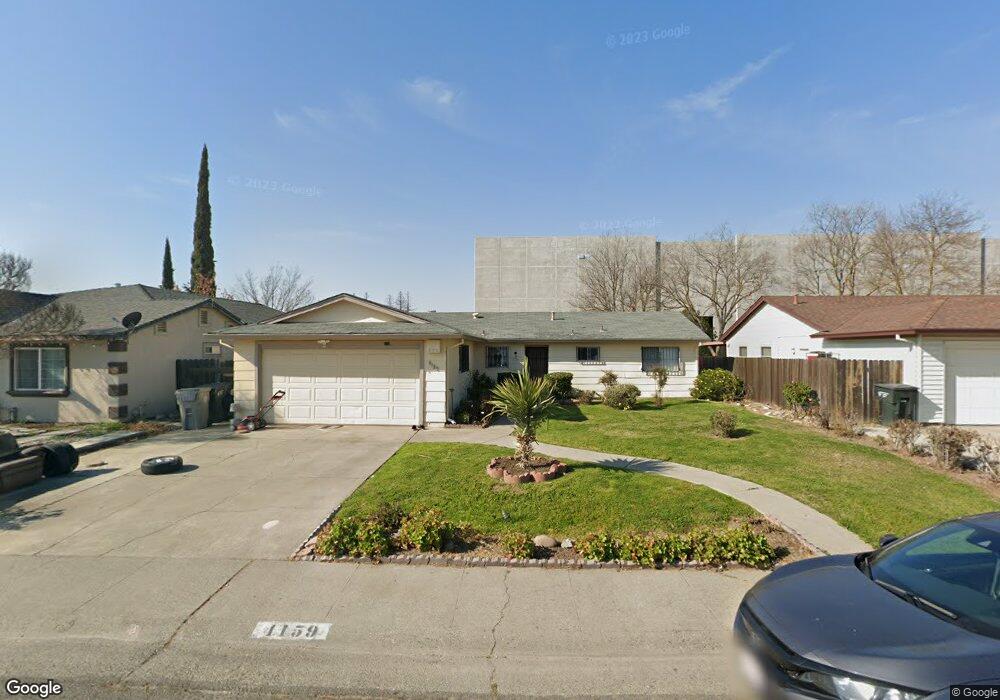
4159 Englewood St Sacramento, CA 95838
Glenwood Meadows NeighborhoodEstimated Value: $358,042 - $460,000
3
Beds
1
Bath
999
Sq Ft
$396/Sq Ft
Est. Value
About This Home
This home is located at 4159 Englewood St, Sacramento, CA 95838 and is currently estimated at $395,681, approximately $396 per square foot. 4159 Englewood St is a home located in Sacramento County with nearby schools including Glenwood Elementary School, Rio Linda Preparatory Academy, and Norwood Junior High School.
Ownership History
Date
Name
Owned For
Owner Type
Purchase Details
Closed on
Jul 24, 2017
Sold by
Singh Bhama Wati
Bought by
Singh Bhama Wati and The Bhama Wati Singh Living Tr
Current Estimated Value
Purchase Details
Closed on
Jun 27, 2005
Sold by
Singh Bhama Wati
Bought by
Singh Bhama Wati
Home Financials for this Owner
Home Financials are based on the most recent Mortgage that was taken out on this home.
Original Mortgage
$138,000
Interest Rate
5.58%
Mortgage Type
New Conventional
Purchase Details
Closed on
May 29, 2002
Sold by
Singh Binjendra and Singh Bhama Wati
Bought by
Singh Binjendra and Singh Bhama Wati
Home Financials for this Owner
Home Financials are based on the most recent Mortgage that was taken out on this home.
Original Mortgage
$100,121
Interest Rate
6.83%
Purchase Details
Closed on
Sep 13, 1998
Sold by
Singh Navendra
Bought by
Singh Bijendra and Singh Bhama Wati
Purchase Details
Closed on
Sep 4, 1998
Sold by
Vashisth Sunita
Bought by
Singh Bijendra and Singh Bhama Wati
Create a Home Valuation Report for This Property
The Home Valuation Report is an in-depth analysis detailing your home's value as well as a comparison with similar homes in the area
Home Values in the Area
Average Home Value in this Area
Purchase History
| Date | Buyer | Sale Price | Title Company |
|---|---|---|---|
| Singh Bhama Wati | -- | None Available | |
| Singh Bhama Wati | -- | United Capital Title Ins Co | |
| Singh Binjendra | -- | Fidelity National Title Co | |
| Singh Bijendra | -- | -- | |
| Singh Bijendra | $53,162 | -- |
Source: Public Records
Mortgage History
| Date | Status | Borrower | Loan Amount |
|---|---|---|---|
| Previous Owner | Singh Bhama Wati | $138,000 | |
| Previous Owner | Singh Binjendra | $100,121 |
Source: Public Records
Tax History Compared to Growth
Tax History
| Year | Tax Paid | Tax Assessment Tax Assessment Total Assessment is a certain percentage of the fair market value that is determined by local assessors to be the total taxable value of land and additions on the property. | Land | Improvement |
|---|---|---|---|---|
| 2025 | $1,612 | $119,017 | $51,568 | $67,449 |
| 2024 | $1,612 | $116,684 | $50,557 | $66,127 |
| 2023 | $2,706 | $114,397 | $49,566 | $64,831 |
| 2022 | $2,608 | $112,155 | $48,595 | $63,560 |
| 2021 | $3,701 | $109,957 | $47,643 | $62,314 |
| 2020 | $2,571 | $108,831 | $47,155 | $61,676 |
| 2019 | $2,562 | $106,698 | $46,231 | $60,467 |
| 2018 | $2,458 | $104,607 | $45,325 | $59,282 |
| 2017 | $1,661 | $102,557 | $44,437 | $58,120 |
| 2016 | $1,379 | $100,547 | $43,566 | $56,981 |
| 2015 | $1,279 | $99,038 | $42,912 | $56,126 |
| 2014 | $3,218 | $97,099 | $42,072 | $55,027 |
Source: Public Records
Map
Nearby Homes
- 230 Du Bois Ave
- 4323 Oconner Way
- 335 Jessie Ave
- 173 Bell Ave
- 328 Las Animas Cir
- 2 Keely Ct
- 1 Butterwick Ct
- 3815 Lee Brook Way
- 131 Mcdaniel Cir
- Plan 7 at Valley Vista
- Plan 3 at Valley Vista
- Plan 7 at Valley Vista
- Plan 8 at Valley Vista
- Plan 8 at Valley Vista
- Plan 3 at Valley Vista
- Plan 1 at Valley Vista
- Plan 1 at Valley Vista
- Plan 3A at Valley Vista
- Plan 3A at Valley Vista
- 21 Oak Manor Way Unit Lot78
- 4149 Englewood St
- 4169 Englewood St
- 4139 Englewood St
- 4179 Englewood St
- 4164 Englewood St
- 4154 Englewood St
- 4129 Englewood St
- 4189 Englewood St
- 210 Jessie Ave
- 4144 Englewood St
- 4134 Englewood St
- 4119 Englewood St
- 4199 Englewood St
- 4124 Englewood St
- 4179 Fruita Ct
- 4149 Fruita Ct
- 220 Jessie Ave
- 4109 Englewood St
- 4139 Fruita Ct
- 4129 Fruita Ct