Estimated Value: $64,783 - $121,000
2
Beds
1
Bath
895
Sq Ft
$110/Sq Ft
Est. Value
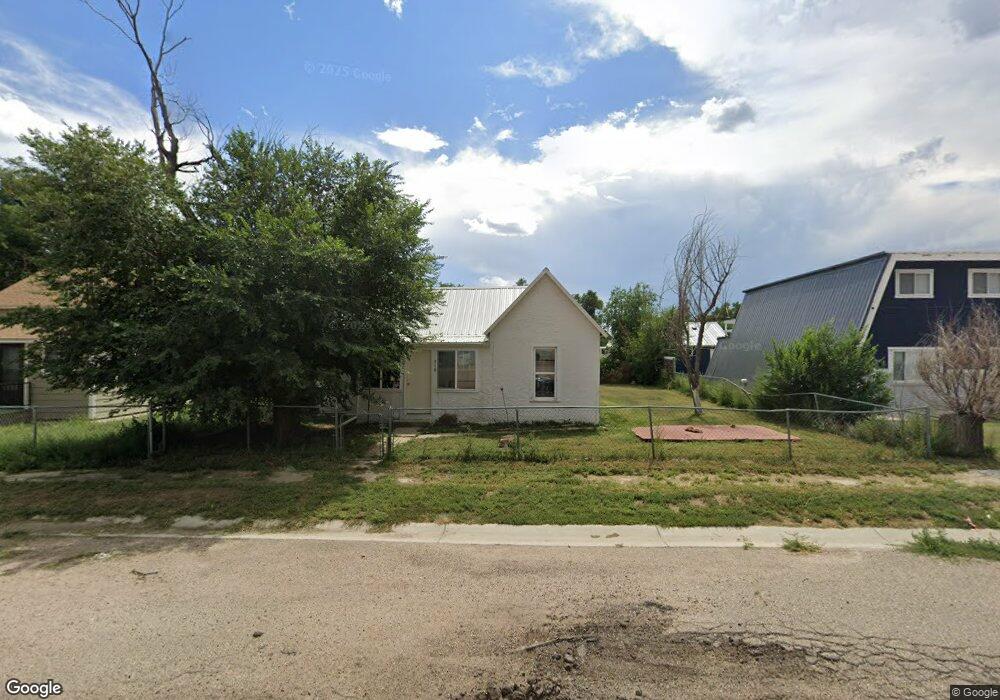
About This Home
This home is located at 416 3rd St, Hugo, CO 80821 and is currently estimated at $98,446, approximately $109 per square foot. 416 3rd St is a home with nearby schools including Genoa-Hugo School.
Ownership History
Date
Name
Owned For
Owner Type
Purchase Details
Closed on
Jan 30, 2009
Sold by
The Younger Living Trust
Bought by
Younger Rentals Llc
Current Estimated Value
Create a Home Valuation Report for This Property
The Home Valuation Report is an in-depth analysis detailing your home's value as well as a comparison with similar homes in the area
Purchase History
| Date | Buyer | Sale Price | Title Company |
|---|---|---|---|
| Younger Rentals Llc | -- | None Available |
Source: Public Records
Tax History
| Year | Tax Paid | Tax Assessment Tax Assessment Total Assessment is a certain percentage of the fair market value that is determined by local assessors to be the total taxable value of land and additions on the property. | Land | Improvement |
|---|---|---|---|---|
| 2025 | $354 | $3,408 | $547 | $2,861 |
| 2024 | $354 | $1,000 | $155 | $845 |
| 2023 | $110 | $1,000 | $155 | $845 |
| 2022 | $322 | $3,101 | $389 | $2,712 |
| 2021 | $332 | $3,190 | $400 | $2,790 |
| 2020 | $262 | $2,536 | $350 | $2,186 |
| 2019 | $245 | $2,536 | $350 | $2,186 |
| 2018 | $176 | $1,692 | $287 | $1,405 |
| 2017 | $170 | $1,692 | $287 | $1,405 |
| 2016 | $179 | $1,812 | $318 | $1,494 |
| 2015 | $168 | $1,812 | $318 | $1,494 |
| 2014 | $183 | $0 | $0 | $0 |
| 2013 | $194 | $0 | $0 | $0 |
Source: Public Records
Map
Nearby Homes
- 0 5th Ave
- 309 8th St
- Highway 109
- 0 Highway 109 Unit 11662605
- 204 Main St
- 53647 County Road 36 4
- Tbd County Road 2z
- County Highway 63
- TBD County Road 2z
- 0 County Road 33
- 27068 County Road 3k
- 714 Michigan Ave
- 368 C Ave
- 672 4th St
- 104 Pine St
- 713 Front St
- 50330 County Road 45
- 1160 Immel St
- 480 F Ave
- 425 G Ave
Your Personal Tour Guide
Ask me questions while you tour the home.