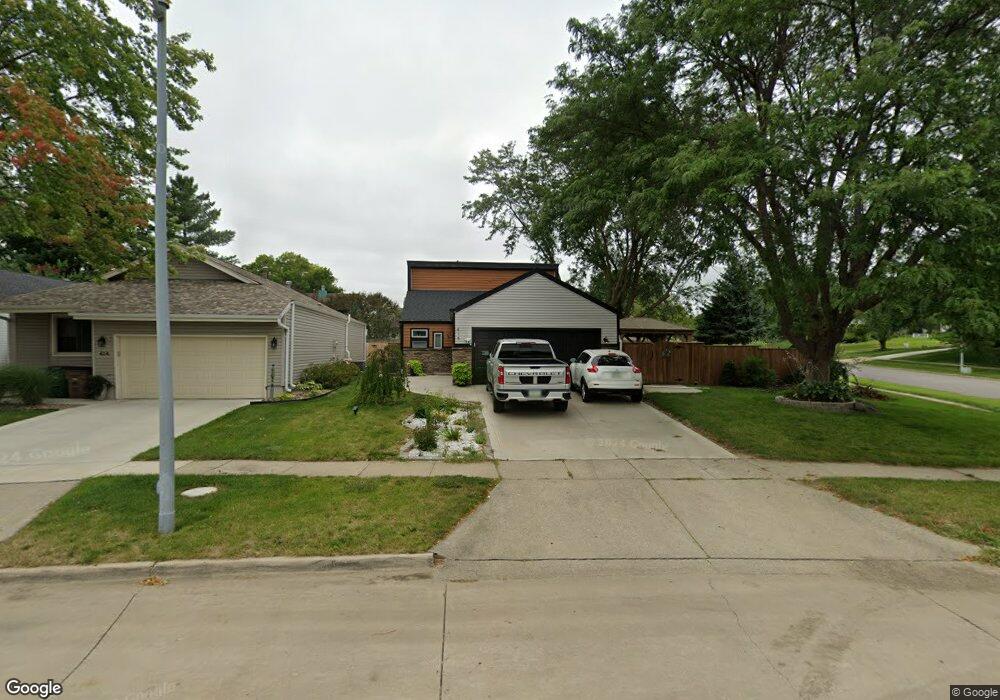
416 51st St West Des Moines, IA 50265
Estimated Value: $266,000 - $323,000
--
Bed
2
Baths
938
Sq Ft
$305/Sq Ft
Est. Value
About This Home
This home is located at 416 51st St, West Des Moines, IA 50265 and is currently estimated at $285,900, approximately $304 per square foot. 416 51st St is a home located in Polk County with nearby schools including Crossroads Park Elementary School, Valley Southwoods Freshman High School, and Indian Hills Junior High School.
Ownership History
Date
Name
Owned For
Owner Type
Purchase Details
Closed on
Dec 20, 2016
Sold by
Thompson Scott A and Thompson Juanita D
Bought by
Iglesias Antonio J and Iglesias Ana P
Current Estimated Value
Purchase Details
Closed on
Feb 23, 2005
Sold by
Rosenow Kirk C and Rosenow Melanie
Bought by
Thompson Scott A and Rosmann Jon Michael
Home Financials for this Owner
Home Financials are based on the most recent Mortgage that was taken out on this home.
Original Mortgage
$280,000
Interest Rate
5.7%
Mortgage Type
Credit Line Revolving
Purchase Details
Closed on
Feb 23, 2000
Sold by
Dorenkamp Erik D and Dorenkamp Kimberly R
Bought by
Rosenow Kirk C
Home Financials for this Owner
Home Financials are based on the most recent Mortgage that was taken out on this home.
Original Mortgage
$112,400
Interest Rate
7.12%
Purchase Details
Closed on
Oct 22, 1997
Sold by
Nichols Anthony J and Nichols Amy L
Bought by
Dorenkamp Erik D and Dorenkamp Kimberly R
Home Financials for this Owner
Home Financials are based on the most recent Mortgage that was taken out on this home.
Original Mortgage
$114,111
Interest Rate
7.65%
Mortgage Type
FHA
Create a Home Valuation Report for This Property
The Home Valuation Report is an in-depth analysis detailing your home's value as well as a comparison with similar homes in the area
Home Values in the Area
Average Home Value in this Area
Purchase History
| Date | Buyer | Sale Price | Title Company |
|---|---|---|---|
| Iglesias Antonio J | $180,000 | None Available | |
| Thompson Scott A | $139,500 | -- | |
| Rosenow Kirk C | $124,500 | -- | |
| Dorenkamp Erik D | $115,000 | -- |
Source: Public Records
Mortgage History
| Date | Status | Borrower | Loan Amount |
|---|---|---|---|
| Previous Owner | Thompson Scott A | $280,000 | |
| Previous Owner | Thompson Scott A | $111,900 | |
| Previous Owner | Rosenow Kirk C | $112,400 | |
| Previous Owner | Dorenkamp Erik D | $114,111 |
Source: Public Records
Tax History Compared to Growth
Tax History
| Year | Tax Paid | Tax Assessment Tax Assessment Total Assessment is a certain percentage of the fair market value that is determined by local assessors to be the total taxable value of land and additions on the property. | Land | Improvement |
|---|---|---|---|---|
| 2025 | $3,856 | $269,100 | $68,500 | $200,600 |
| 2024 | $3,856 | $250,300 | $63,400 | $186,900 |
| 2023 | $3,902 | $253,800 | $63,400 | $190,400 |
| 2022 | $3,856 | $211,000 | $54,500 | $156,500 |
| 2021 | $3,776 | $211,000 | $54,500 | $156,500 |
| 2020 | $3,716 | $196,900 | $50,900 | $146,000 |
| 2019 | $3,368 | $196,900 | $50,900 | $146,000 |
| 2018 | $3,372 | $172,900 | $45,300 | $127,600 |
| 2017 | $3,280 | $172,900 | $45,300 | $127,600 |
| 2016 | $3,210 | $155,200 | $40,300 | $114,900 |
| 2015 | $3,210 | $155,200 | $40,300 | $114,900 |
| 2014 | $3,092 | $147,800 | $37,700 | $110,100 |
Source: Public Records
Map
Nearby Homes
- 513 52nd St
- 4808 Stonebridge Rd
- 455 52nd Place
- 521 51st St
- 5242 Dakota Dr
- 5101 Dakota Dr
- 5255 Dakota Dr
- 509 53rd St
- 5207 Pommel Place
- 181 52nd St
- 724 Knolls Ct
- 636 47th St
- 608 53rd St
- 756 Knolls Ct
- 4600 Aspen Dr
- 5005 Colt Dr
- 108 S 46th St
- 4400 Ep True Pkwy Unit 43
- 4400 Ep True Pkwy Unit 25
- 4801 Meadow Valley Dr