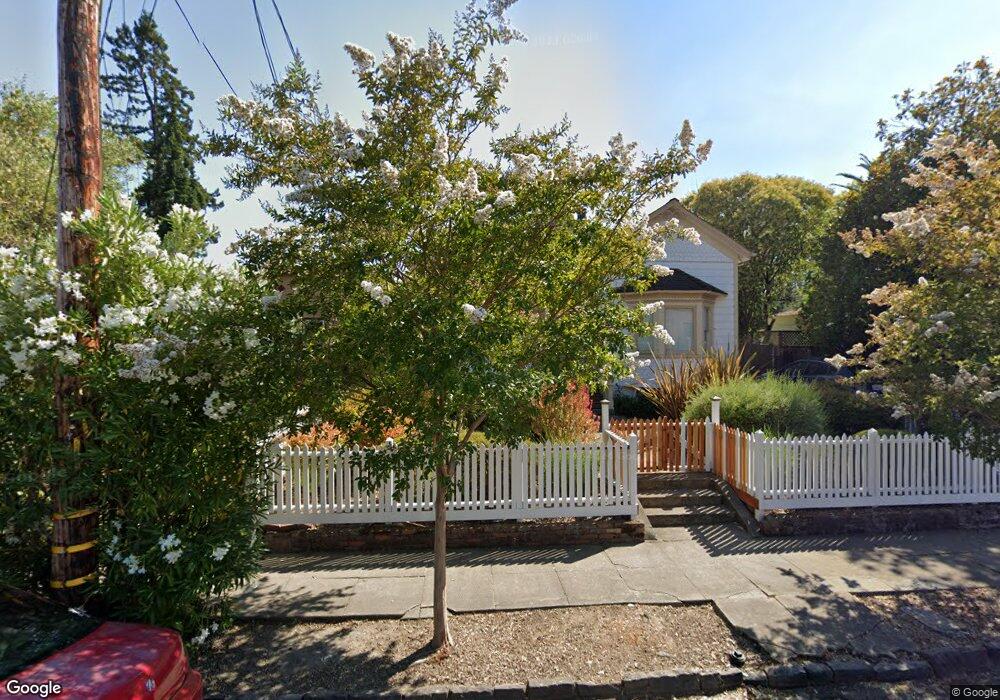
416 7th St Petaluma, CA 94952
Western Petaluma NeighborhoodEstimated Value: $987,903 - $1,086,000
2
Beds
2
Baths
1,328
Sq Ft
$770/Sq Ft
Est. Value
About This Home
This home is located at 416 7th St, Petaluma, CA 94952 and is currently estimated at $1,022,226, approximately $769 per square foot. 416 7th St is a home located in Sonoma County with nearby schools including McNear Elementary School, Petaluma Junior High School, and Petaluma High School.
Ownership History
Date
Name
Owned For
Owner Type
Purchase Details
Closed on
Mar 5, 2009
Sold by
Schultz Gloria Ann
Bought by
Delucia Zeltzer Susan E and Delucia Zeltzer Matthew
Current Estimated Value
Home Financials for this Owner
Home Financials are based on the most recent Mortgage that was taken out on this home.
Original Mortgage
$416,000
Outstanding Balance
$263,114
Interest Rate
5.03%
Mortgage Type
Purchase Money Mortgage
Estimated Equity
$759,112
Create a Home Valuation Report for This Property
The Home Valuation Report is an in-depth analysis detailing your home's value as well as a comparison with similar homes in the area
Home Values in the Area
Average Home Value in this Area
Purchase History
| Date | Buyer | Sale Price | Title Company |
|---|---|---|---|
| Delucia Zeltzer Susan E | $520,000 | Fidelity National Title Co |
Source: Public Records
Mortgage History
| Date | Status | Borrower | Loan Amount |
|---|---|---|---|
| Open | Delucia Zeltzer Susan E | $416,000 |
Source: Public Records
Tax History
| Year | Tax Paid | Tax Assessment Tax Assessment Total Assessment is a certain percentage of the fair market value that is determined by local assessors to be the total taxable value of land and additions on the property. | Land | Improvement |
|---|---|---|---|---|
| 2025 | $7,194 | $669,619 | $257,543 | $412,076 |
| 2024 | $7,194 | $656,491 | $252,494 | $403,997 |
| 2023 | $7,194 | $643,620 | $247,544 | $396,076 |
| 2022 | $6,960 | $631,001 | $242,691 | $388,310 |
| 2021 | $6,828 | $618,630 | $237,933 | $380,697 |
| 2020 | $6,886 | $612,288 | $235,494 | $376,794 |
| 2019 | $6,800 | $600,283 | $230,877 | $369,406 |
| 2018 | $6,772 | $588,513 | $226,350 | $362,163 |
| 2017 | $6,630 | $576,974 | $221,912 | $355,062 |
| 2016 | $6,472 | $565,661 | $217,561 | $348,100 |
| 2015 | $6,381 | $557,166 | $214,294 | $342,872 |
| 2014 | $6,349 | $546,253 | $210,097 | $336,156 |
Source: Public Records
Map
Nearby Homes
Your Personal Tour Guide
Ask me questions while you tour the home.