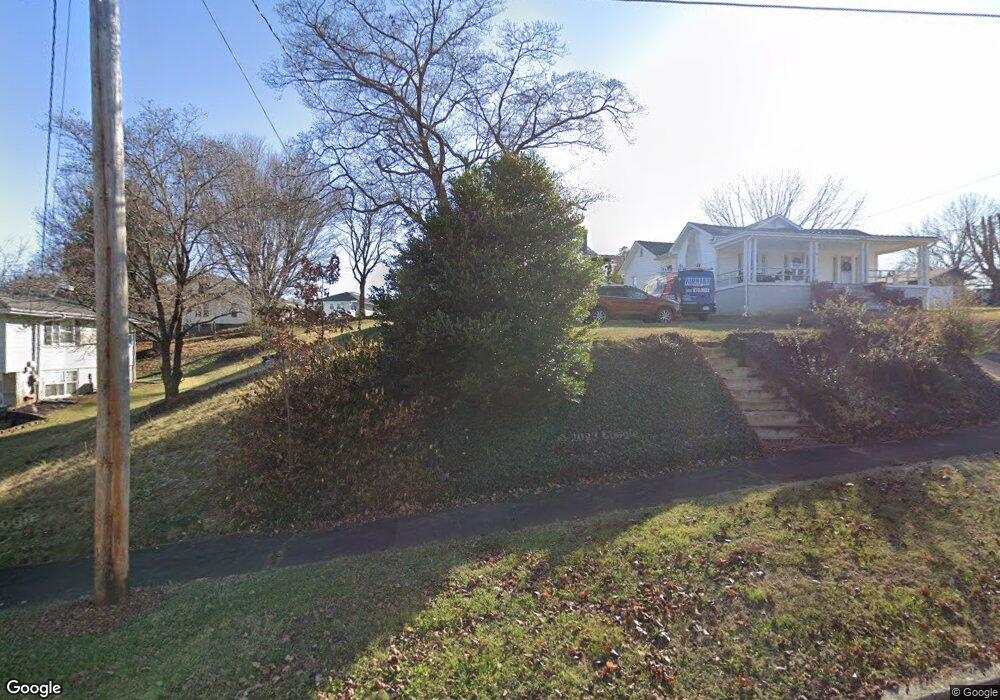
416 E K St Elizabethton, TN 37643
Estimated Value: $168,000 - $294,000
--
Bed
1
Bath
2,022
Sq Ft
$110/Sq Ft
Est. Value
About This Home
This home is located at 416 E K St, Elizabethton, TN 37643 and is currently estimated at $221,831, approximately $109 per square foot. 416 E K St is a home located in Carter County with nearby schools including Elizabethton High School and East Tn Christian Home & Academy.
Ownership History
Date
Name
Owned For
Owner Type
Purchase Details
Closed on
Jul 23, 2024
Sold by
Oliver Jearld D and Oliver Kimberly J
Bought by
Back Jon Andrew and Back Alexis Nicole
Current Estimated Value
Home Financials for this Owner
Home Financials are based on the most recent Mortgage that was taken out on this home.
Original Mortgage
$211,105
Outstanding Balance
$208,584
Interest Rate
6.99%
Mortgage Type
FHA
Estimated Equity
$13,247
Purchase Details
Closed on
Apr 3, 1995
Sold by
Cochran Timothy D
Bought by
Oliver Jerold
Purchase Details
Closed on
Jun 10, 1992
Bought by
Cochran Timothy D and Debra Lynn Coch
Purchase Details
Closed on
Jan 24, 1983
Bought by
Cochran Lawrence and Cochran Patricia
Create a Home Valuation Report for This Property
The Home Valuation Report is an in-depth analysis detailing your home's value as well as a comparison with similar homes in the area
Home Values in the Area
Average Home Value in this Area
Purchase History
| Date | Buyer | Sale Price | Title Company |
|---|---|---|---|
| Back Jon Andrew | $215,000 | None Listed On Document | |
| Oliver Jerold | $48,000 | -- | |
| Cochran Timothy D | $30,700 | -- | |
| Cochran Lawrence | -- | -- |
Source: Public Records
Mortgage History
| Date | Status | Borrower | Loan Amount |
|---|---|---|---|
| Open | Back Jon Andrew | $211,105 |
Source: Public Records
Tax History Compared to Growth
Tax History
| Year | Tax Paid | Tax Assessment Tax Assessment Total Assessment is a certain percentage of the fair market value that is determined by local assessors to be the total taxable value of land and additions on the property. | Land | Improvement |
|---|---|---|---|---|
| 2024 | $866 | $26,250 | $3,575 | $22,675 |
| 2023 | $866 | $26,250 | $0 | $0 |
| 2022 | $945 | $26,250 | $3,575 | $22,675 |
| 2021 | $533 | $26,250 | $3,575 | $22,675 |
| 2020 | $905 | $26,250 | $3,575 | $22,675 |
| 2019 | $905 | $20,950 | $2,400 | $18,550 |
| 2018 | $892 | $20,950 | $2,400 | $18,550 |
| 2017 | $886 | $20,950 | $2,400 | $18,550 |
| 2016 | $882 | $20,800 | $2,400 | $18,400 |
| 2015 | $884 | $20,800 | $2,400 | $18,400 |
| 2014 | $908 | $21,275 | $2,400 | $18,875 |
Source: Public Records
Map
Nearby Homes