Estimated Value: $240,030 - $332,000
3
Beds
2
Baths
1,946
Sq Ft
$147/Sq Ft
Est. Value
About This Home
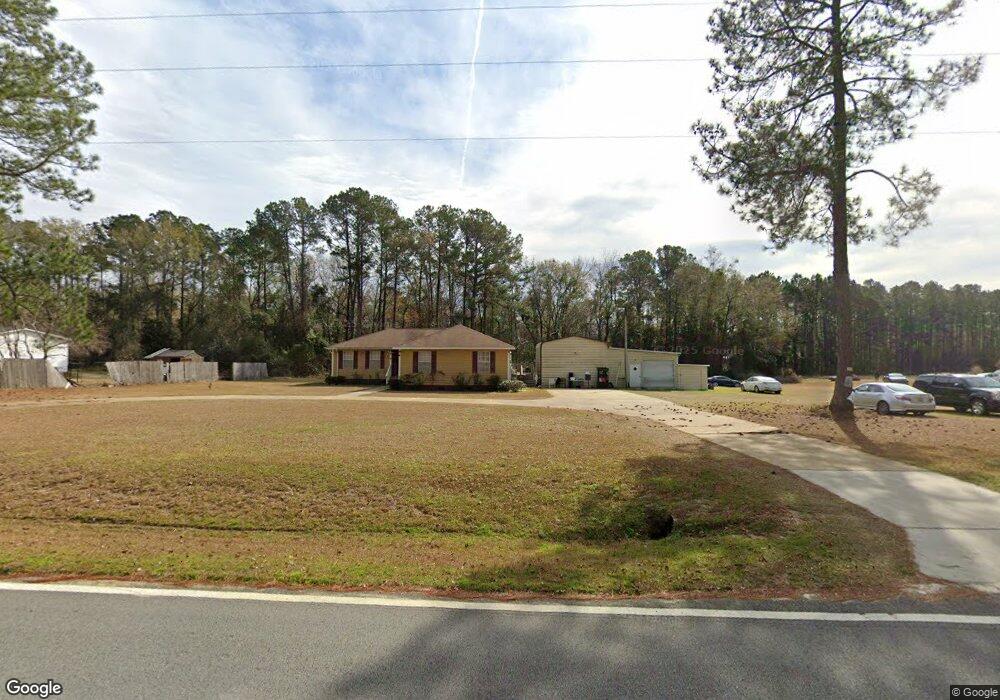
This home is located at 416 Johnson Rd, Cairo, GA 39828 and is currently estimated at $285,508, approximately $146 per square foot. 416 Johnson Rd is a home located in Grady County.
Ownership History
Date
Name
Owned For
Owner Type
Purchase Details
Closed on
Nov 30, 2021
Sold by
Gordon Kelvin B
Bought by
Gordon Kelvin B and Gordon Petula Loraine
Current Estimated Value
Purchase Details
Closed on
Mar 19, 2007
Sold by
Pillers Lawrence
Bought by
Gordon Kelvin B
Purchase Details
Closed on
Nov 15, 2004
Sold by
Cox Robert N
Bought by
Pillers Lawrence
Purchase Details
Closed on
Jan 8, 2004
Sold by
Miller Bernice
Bought by
Cox Robert N
Purchase Details
Closed on
Jun 1, 2001
Sold by
Shervis Toywonder
Bought by
Miller Bernice
Purchase Details
Closed on
Mar 12, 1999
Sold by
Cox Robert N
Bought by
Shervis Toywonder
Purchase Details
Closed on
Mar 3, 1992
Bought by
Cox Robert N
Create a Home Valuation Report for This Property
The Home Valuation Report is an in-depth analysis detailing your home's value as well as a comparison with similar homes in the area
Purchase History
| Date | Buyer | Sale Price | Title Company |
|---|---|---|---|
| Gordon Kelvin B | -- | -- | |
| Gordon Kelvin B | -- | -- | |
| Pillers Lawrence | $24,000 | -- | |
| Cox Robert N | -- | -- | |
| Miller Bernice | $26,000 | -- | |
| Shervis Toywonder | $15,000 | -- | |
| Cox Robert N | -- | -- |
Source: Public Records
Tax History
| Year | Tax Paid | Tax Assessment Tax Assessment Total Assessment is a certain percentage of the fair market value that is determined by local assessors to be the total taxable value of land and additions on the property. | Land | Improvement |
|---|---|---|---|---|
| 2025 | $1,475 | $70,899 | $7,725 | $63,174 |
| 2024 | $1,475 | $75,671 | $7,120 | $68,551 |
| 2023 | $1,575 | $53,168 | $1,654 | $51,514 |
| 2022 | $1,575 | $53,168 | $1,654 | $51,514 |
| 2021 | $1,580 | $53,168 | $1,654 | $51,514 |
| 2020 | $1,586 | $53,168 | $1,654 | $51,514 |
| 2019 | $1,410 | $47,492 | $1,654 | $45,838 |
| 2018 | $1,323 | $47,492 | $1,654 | $45,838 |
| 2017 | $1,260 | $47,492 | $1,654 | $45,838 |
| 2016 | $1,052 | $39,773 | $1,654 | $38,118 |
| 2015 | $1,039 | $39,773 | $1,654 | $38,118 |
| 2014 | $1,041 | $39,773 | $1,654 | $38,118 |
| 2013 | -- | $34,500 | $1,654 | $32,846 |
Source: Public Records
Map
Nearby Homes
- 4258 Lower Hawthorne Trail
- 198 2nd Ave
- 48 Blue Bird Ct
- 71 Bob White Trail
- 177 Quail Ridge
- 7667 Tallahassee Hwy
- 36 Horseshoe Rd
- XXXX Xxxx Fairbanks Ferry
- Hwy 27
- 203 Patterson Ln
- 9949 Florida Georgia Hwy
- 9778 Florida Georgia Hwy
- 4115 Concord Rd
- 290 Schwall Rd
- 404 Beaver Lake Rd
- 1447 Deer Run Rd
- 14257 Buckhorn Rd
- 465 Dogwood Dr
- 226 My St
- 00 Tired Creek Rd
- 436 Johnson Rd
- 132 Calvary Ridge Rd
- 448 Thomas Rd
- 199 Calvary Ridge Rd
- 105 Pine Hill Lakes Dr
- 433 Thomas Rd
- 416 Thomas Rd
- 124 Pine Hill Lakes Dr
- 133 Pine Hill Lakes Dr
- 133 Pine Hill Lakes Dr
- 163 Pine Hill Lakes Dr
- 384 Thomas Rd
- 160 Pine Hill Lakes Dr
- 181 Pine Hill Lakes Dr
- 345 Thomas Rd
- 296 Calvary Ridge Rd
- 31 & 32 Pine Hill Lakes Dr
- 0 Johnson & Pine Lakes Rd Unit 3.41 ACRES 10246411
- LOT 2 Johnson Rd Unit 1.51 ACRES
- 0 Johnson Rd Unit 1.55 ACRES 10242130
Your Personal Tour Guide
Ask me questions while you tour the home.