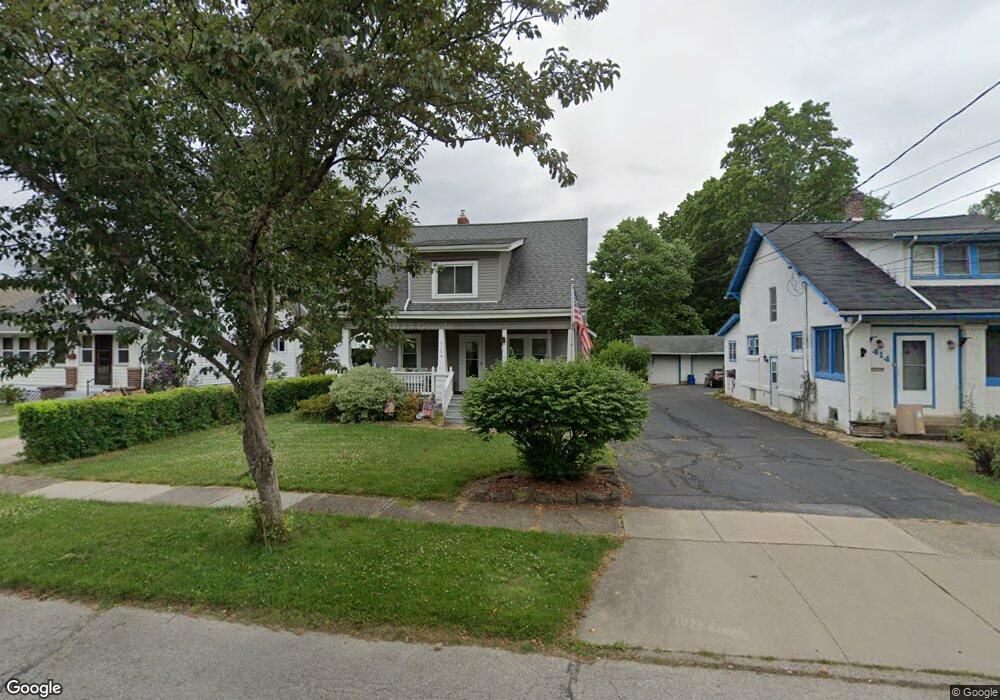
416 Myrtle St Ravenna, OH 44266
Estimated Value: $146,000 - $158,000
3
Beds
1
Bath
1,083
Sq Ft
$139/Sq Ft
Est. Value
About This Home
This home is located at 416 Myrtle St, Ravenna, OH 44266 and is currently estimated at $151,032, approximately $139 per square foot. 416 Myrtle St is a home located in Portage County with nearby schools including West Main Elementary School, West Park Elementary School, and Brown Middle School.
Ownership History
Date
Name
Owned For
Owner Type
Purchase Details
Closed on
Aug 22, 2022
Sold by
Rorabeck Orin
Bought by
Sandra J Rorabeck
Current Estimated Value
Purchase Details
Closed on
Jul 3, 1996
Sold by
Mazzola John C
Bought by
Rorabeck Orin and Rorabeck Sandra J
Home Financials for this Owner
Home Financials are based on the most recent Mortgage that was taken out on this home.
Original Mortgage
$69,964
Interest Rate
8.07%
Mortgage Type
FHA
Create a Home Valuation Report for This Property
The Home Valuation Report is an in-depth analysis detailing your home's value as well as a comparison with similar homes in the area
Home Values in the Area
Average Home Value in this Area
Purchase History
| Date | Buyer | Sale Price | Title Company |
|---|---|---|---|
| Sandra J Rorabeck | -- | -- | |
| Rorabeck Orin | $70,000 | -- |
Source: Public Records
Mortgage History
| Date | Status | Borrower | Loan Amount |
|---|---|---|---|
| Previous Owner | Rorabeck Orin | $69,964 |
Source: Public Records
Tax History Compared to Growth
Tax History
| Year | Tax Paid | Tax Assessment Tax Assessment Total Assessment is a certain percentage of the fair market value that is determined by local assessors to be the total taxable value of land and additions on the property. | Land | Improvement |
|---|---|---|---|---|
| 2024 | $1,265 | $44,560 | $5,670 | $38,890 |
| 2023 | $1,081 | $33,500 | $5,670 | $27,830 |
| 2022 | $1,489 | $33,500 | $5,670 | $27,830 |
| 2021 | $1,491 | $33,500 | $5,670 | $27,830 |
| 2020 | $1,400 | $27,930 | $5,670 | $22,260 |
| 2019 | $1,401 | $27,930 | $5,670 | $22,260 |
| 2018 | $1,239 | $23,350 | $7,250 | $16,100 |
| 2017 | $1,239 | $23,350 | $7,250 | $16,100 |
| 2016 | $1,165 | $23,350 | $7,250 | $16,100 |
| 2015 | $1,166 | $23,350 | $7,250 | $16,100 |
| 2014 | $1,165 | $23,350 | $7,250 | $16,100 |
| 2013 | $1,157 | $23,350 | $7,250 | $16,100 |
Source: Public Records
Map
Nearby Homes