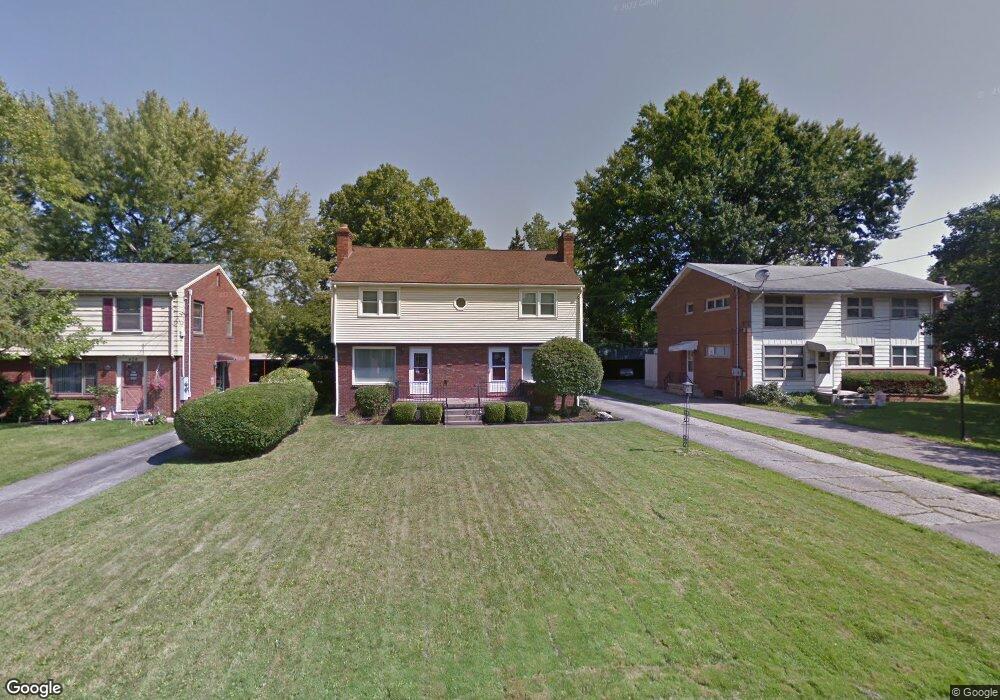
416 Old Shay Ln Unit 418 Youngstown, OH 44512
Estimated Value: $164,000 - $191,335
4
Beds
2
Baths
2,340
Sq Ft
$77/Sq Ft
Est. Value
About This Home
This home is located at 416 Old Shay Ln Unit 418, Youngstown, OH 44512 and is currently estimated at $180,834, approximately $77 per square foot. 416 Old Shay Ln Unit 418 is a home located in Mahoning County with nearby schools including West Boulevard Elementary School, Boardman Center Middle School, and Boardman High School.
Ownership History
Date
Name
Owned For
Owner Type
Purchase Details
Closed on
Jan 31, 2003
Sold by
Graff Joseph
Bought by
Graff Joseph and Graff Anita J
Current Estimated Value
Purchase Details
Closed on
Feb 21, 2001
Sold by
Desanto Jeanne B
Bought by
Graff Joseph
Home Financials for this Owner
Home Financials are based on the most recent Mortgage that was taken out on this home.
Original Mortgage
$84,550
Outstanding Balance
$30,495
Interest Rate
7.06%
Mortgage Type
Purchase Money Mortgage
Estimated Equity
$150,339
Purchase Details
Closed on
Dec 19, 1995
Sold by
Bitonte Esther
Bought by
Desanto Joanne
Home Financials for this Owner
Home Financials are based on the most recent Mortgage that was taken out on this home.
Original Mortgage
$35,000
Interest Rate
7.45%
Mortgage Type
New Conventional
Purchase Details
Closed on
May 1, 1995
Bought by
Graff Joseph and Graff Anita J
Create a Home Valuation Report for This Property
The Home Valuation Report is an in-depth analysis detailing your home's value as well as a comparison with similar homes in the area
Home Values in the Area
Average Home Value in this Area
Purchase History
| Date | Buyer | Sale Price | Title Company |
|---|---|---|---|
| Graff Joseph | -- | -- | |
| Graff Joseph | $89,000 | Safeguard Title Agency | |
| Desanto Joanne | $35,000 | -- | |
| Graff Joseph | -- | -- |
Source: Public Records
Mortgage History
| Date | Status | Borrower | Loan Amount |
|---|---|---|---|
| Open | Graff Joseph | $84,550 | |
| Previous Owner | Desanto Joanne | $35,000 |
Source: Public Records
Tax History Compared to Growth
Tax History
| Year | Tax Paid | Tax Assessment Tax Assessment Total Assessment is a certain percentage of the fair market value that is determined by local assessors to be the total taxable value of land and additions on the property. | Land | Improvement |
|---|---|---|---|---|
| 2024 | $2,319 | $45,270 | $7,110 | $38,160 |
| 2023 | $2,289 | $45,270 | $7,110 | $38,160 |
| 2022 | $1,838 | $27,760 | $7,190 | $20,570 |
| 2021 | $1,840 | $27,760 | $7,190 | $20,570 |
| 2020 | $1,849 | $27,760 | $7,190 | $20,570 |
| 2019 | $1,794 | $23,930 | $6,200 | $17,730 |
| 2018 | $1,560 | $23,930 | $6,200 | $17,730 |
| 2017 | $1,557 | $23,930 | $6,200 | $17,730 |
| 2016 | $1,801 | $27,420 | $6,200 | $21,220 |
| 2015 | $1,766 | $27,420 | $6,200 | $21,220 |
| 2014 | $2,063 | $31,940 | $6,200 | $25,740 |
| 2013 | $2,038 | $31,940 | $6,200 | $25,740 |
Source: Public Records
Map
Nearby Homes
- 5200 West Blvd Unit 505
- 537 W Glen Dr
- 272 Shields Rd
- 5020 Friendship Ave
- 4478 Devonshire Dr Unit 1B
- 29 Gillian Ln
- 49 Shields Rd
- 169 Wolcott Dr
- 4225 Stratford Rd
- 4250 Oak Knoll Dr
- 117 Overhill Rd
- 715 Crestview Dr
- 28 Terrace Dr
- 4141 Windsor Rd
- 990 Westport Dr
- 21.19 acres Truesdale and Lockwood Rd
- 272 Ewing Rd
- 44 Gertrude Ave
- 772 Ewing Rd
- 60 Shadyside Dr
- 424 Old Shay Ln
- 412 Old Shay Ln Unit 414
- 5247 West Blvd Unit 249
- 5232 Old Oxford Ln
- 5230 Old Oxford Ln Unit 232
- 5220 Old Oxford Ln Unit 224
- 5240 Old Oxford Ln Unit 242
- 369 Shields Rd Unit 5
- 369 Shields Rd Unit 1
- 369 Shields Rd
- 367 Shields Rd
- 421 Old Shay Ln
- 415 Old Shay Ln Unit 417
- 413 Old Shay Ln
- 425 Old Shay Ln
- 411 Old Shay Ln Unit SHAY
- 411 Old Shay Ln
- 411 Old Shay Ln Unit 413
- 5227 Old Oxford Ln
- 429 Old Shay Ln