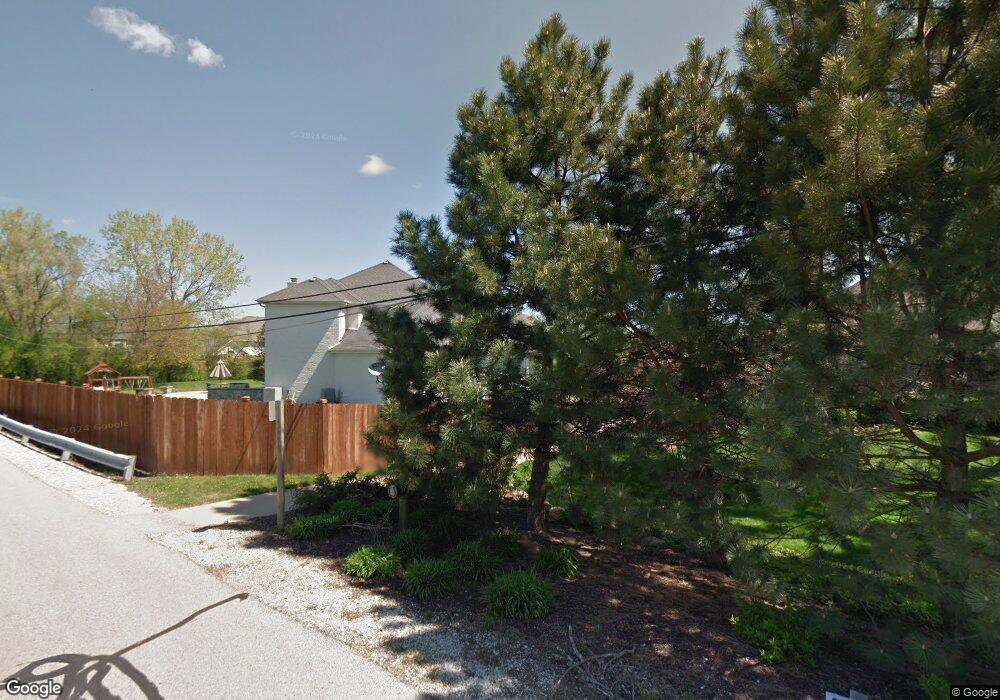
416 Periwinkle Way Prospect Heights, IL 60070
Estimated Value: $826,000 - $1,152,000
4
Beds
5
Baths
3,829
Sq Ft
$259/Sq Ft
Est. Value
About This Home
This home is located at 416 Periwinkle Way, Prospect Heights, IL 60070 and is currently estimated at $991,869, approximately $259 per square foot. 416 Periwinkle Way is a home located in Cook County with nearby schools including Dwight D Eisenhower Elementary School, Anne Sullivan Elementary School, and Betsy Ross Elementary School.
Ownership History
Date
Name
Owned For
Owner Type
Purchase Details
Closed on
Mar 29, 2017
Sold by
Pappas Sam and Loukopoulos Maria
Bought by
Pritsker Evgeni and Pritsker Alina
Current Estimated Value
Home Financials for this Owner
Home Financials are based on the most recent Mortgage that was taken out on this home.
Original Mortgage
$270,000
Outstanding Balance
$224,926
Interest Rate
4.25%
Mortgage Type
New Conventional
Estimated Equity
$766,943
Purchase Details
Closed on
Jun 6, 2000
Sold by
Pappas Sam
Bought by
Pappas Sam and Pappas Maria
Home Financials for this Owner
Home Financials are based on the most recent Mortgage that was taken out on this home.
Original Mortgage
$125,000
Interest Rate
8.14%
Purchase Details
Closed on
Nov 17, 1998
Sold by
Nauert Builders Inc
Bought by
Pappas Sam
Home Financials for this Owner
Home Financials are based on the most recent Mortgage that was taken out on this home.
Original Mortgage
$400,000
Interest Rate
6.75%
Create a Home Valuation Report for This Property
The Home Valuation Report is an in-depth analysis detailing your home's value as well as a comparison with similar homes in the area
Home Values in the Area
Average Home Value in this Area
Purchase History
| Date | Buyer | Sale Price | Title Company |
|---|---|---|---|
| Pritsker Evgeni | $659,000 | Attorney | |
| Pappas Sam | -- | Oconnor Title Guaranty Inc | |
| Pappas Sam | $505,000 | -- |
Source: Public Records
Mortgage History
| Date | Status | Borrower | Loan Amount |
|---|---|---|---|
| Open | Pritsker Evgeni | $270,000 | |
| Previous Owner | Pappas Sam | $125,000 | |
| Previous Owner | Pappas Sam | $400,000 |
Source: Public Records
Tax History Compared to Growth
Tax History
| Year | Tax Paid | Tax Assessment Tax Assessment Total Assessment is a certain percentage of the fair market value that is determined by local assessors to be the total taxable value of land and additions on the property. | Land | Improvement |
|---|---|---|---|---|
| 2024 | $18,271 | $64,110 | $22,374 | $41,736 |
| 2023 | $17,101 | $64,110 | $22,374 | $41,736 |
| 2022 | $17,101 | $64,110 | $22,374 | $41,736 |
| 2021 | $18,247 | $58,980 | $13,983 | $44,997 |
| 2020 | $17,743 | $58,980 | $13,983 | $44,997 |
| 2019 | $17,706 | $65,900 | $13,983 | $51,917 |
| 2018 | $18,506 | $59,862 | $11,885 | $47,977 |
| 2017 | $17,266 | $59,862 | $11,885 | $47,977 |
| 2016 | $19,198 | $69,971 | $11,885 | $58,086 |
| 2015 | $19,764 | $65,528 | $10,487 | $55,041 |
| 2014 | $19,572 | $65,528 | $10,487 | $55,041 |
| 2013 | $19,073 | $65,528 | $10,487 | $55,041 |
Source: Public Records
Map
Nearby Homes
- 1044 Creekside Ct Unit 2B
- 412 Cherry Creek Ln
- 1500 Harbour Dr Unit 1D
- 1500 Harbour Dr Unit 2K
- 1054 Harbour Ct Unit 1A
- 1038 Harbour Ct Unit 2A
- 2143 E Peachtree Ln
- 2060 N Charter Point Dr Unit 14
- 1925 E Waverly Ln
- 791 Lakeside Circle Dr Unit 1
- 2616 N Prindle Ave
- 21 E Stonegate Dr
- 2812 Jackson Dr
- 705 Lakeside Circle Dr Unit 2
- 1964 N Coldspring Rd Unit 52
- 1956 N Lake Arlington Dr
- 1949 N Charter Point Dr Unit 1949
- 2822 Jackson Dr
- 691 Lakeside Circle Dr
- 307 Anne Ct
- 414 Periwinkle Way
- 415 Periwinkle Way
- 1084 Cornell Ave Unit 1BL
- 1084 Cornell Ave Unit 2BL
- 1084 Cornell Ave Unit 2AL
- 1084 Cornell Ave Unit 1AL
- 1084 Cornell Ave Unit 2B
- 1074 Cornell Ave Unit 1AR
- 1074 Cornell Ave Unit 2BR
- 1074 Cornell Ave Unit 2AR
- 1074 Cornell Ave Unit 1BR
- 1074 Cornell Ave Unit 2A
- 1074 Cornell Ave Unit 2B
- 1074 Cornell Ave Unit 1A
- 1074 Cornell Ave Unit 1B
- 415 Cherry Creek Ln
- 1094 Cornell Ave Unit 1B
- 1094 Cornell Ave Unit 2A
- 412 Periwinkle Way
- 1044 Creekside Ct Unit 1BR