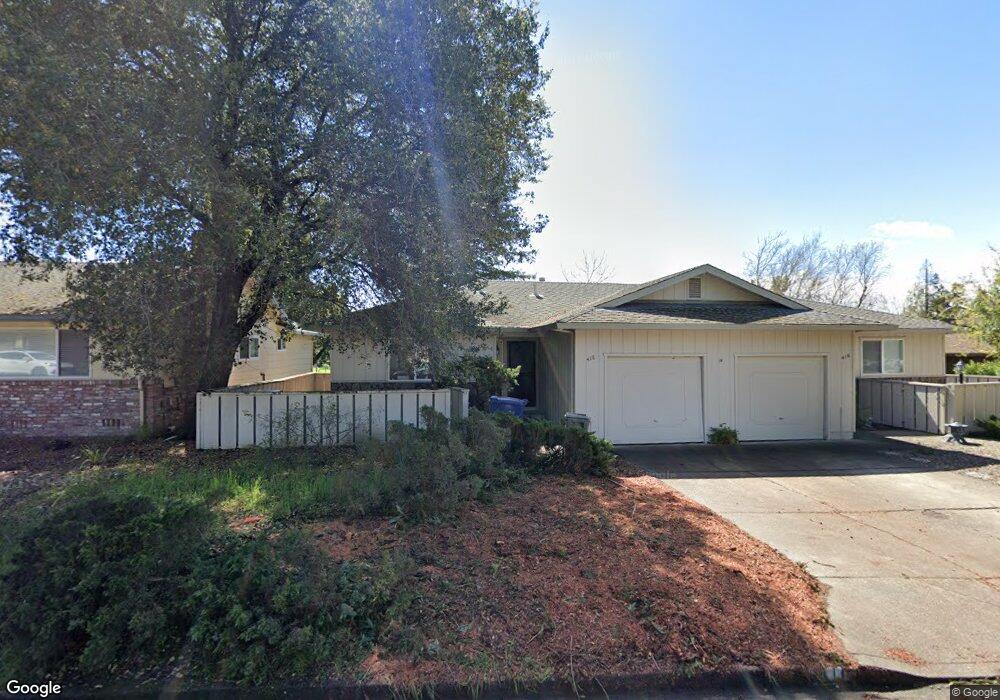
416 Pheasant Ln Santa Rosa, CA 95403
Estimated Value: $712,000 - $889,000
4
Beds
6
Baths
2,104
Sq Ft
$381/Sq Ft
Est. Value
About This Home
This home is located at 416 Pheasant Ln, Santa Rosa, CA 95403 and is currently estimated at $802,180, approximately $381 per square foot. 416 Pheasant Ln is a home located in Sonoma County with nearby schools including Santa Rosa Middle School, Santa Rosa High School, and San Miguel Elementary School.
Ownership History
Date
Name
Owned For
Owner Type
Purchase Details
Closed on
Oct 11, 2019
Sold by
Wallace John C and Wallace Family Trust
Bought by
Clark Wallace John C and Clark Wallace Dean
Current Estimated Value
Purchase Details
Closed on
Mar 13, 1998
Sold by
Wallace John and Wallace Deanna
Bought by
Wallace John C and Wallace Deanna J
Create a Home Valuation Report for This Property
The Home Valuation Report is an in-depth analysis detailing your home's value as well as a comparison with similar homes in the area
Home Values in the Area
Average Home Value in this Area
Purchase History
| Date | Buyer | Sale Price | Title Company |
|---|---|---|---|
| Clark Wallace John C | -- | None Available | |
| Wallace John C | -- | -- |
Source: Public Records
Tax History Compared to Growth
Tax History
| Year | Tax Paid | Tax Assessment Tax Assessment Total Assessment is a certain percentage of the fair market value that is determined by local assessors to be the total taxable value of land and additions on the property. | Land | Improvement |
|---|---|---|---|---|
| 2025 | $5,829 | $836,400 | $285,600 | $550,800 |
| 2024 | $5,829 | $292,480 | $91,396 | $201,084 |
| 2023 | $5,829 | $286,746 | $89,604 | $197,142 |
| 2022 | $5,304 | $281,125 | $87,848 | $193,277 |
| 2021 | $5,092 | $275,614 | $86,126 | $189,488 |
| 2020 | $5,012 | $272,789 | $85,243 | $187,546 |
| 2019 | $4,912 | $267,441 | $83,572 | $183,869 |
| 2018 | $4,579 | $262,198 | $81,934 | $180,264 |
| 2017 | $0 | $257,058 | $80,328 | $176,730 |
| 2016 | $4,351 | $252,018 | $78,753 | $173,265 |
| 2015 | -- | $248,234 | $77,571 | $170,663 |
| 2014 | -- | $243,372 | $76,052 | $167,320 |
Source: Public Records
Map
Nearby Homes
- 446 Las Casitas Unit D
- 442 Las Casitas Ct Unit A
- 442 Las Casitas Ct Unit C
- 1447 Wikiup Dr
- 1385 Wikiup Dr
- 5330 Arnica Way
- 5525 Carriage Ln
- 111 Mark West Commons Cir
- 5275 Wikiup Ct
- 1335 Wikiup Dr
- 104 Creek Way
- 1328 Wikiup Dr
- 5262 Wikiup Ct
- 4980 Carriage Ln
- 66 Noonan Ranch Cir
- 5095 Knollwood Ct
- 70 Noonan Ranch Cir
- 1064 Wikiup Dr
- 1253 Wikiup Dr
- 2431 Midnight Ln
- 412 Pheasant Ln
- 439 Pheasant Ln
- 435 Pheasant Ln
- 408 Pheasant Ln
- 424 Pheasant Ln
- 443 Pheasant Ln
- 328 Candlelight Dr
- 406 Pheasant Ln
- 430 Pheasant Ln
- 342 Candlelight Dr
- 445 Pheasant Ln
- 421 Pheasant Ln
- 413 Pheasant Ln
- 425 Pheasant Ln
- 320 Candlelight Dr
- 415 Pheasant Ln
- 402 Pheasant Ln
- 350 Candlelight Dr
- 431 Pheasant Ln
- 427 Pheasant Ln