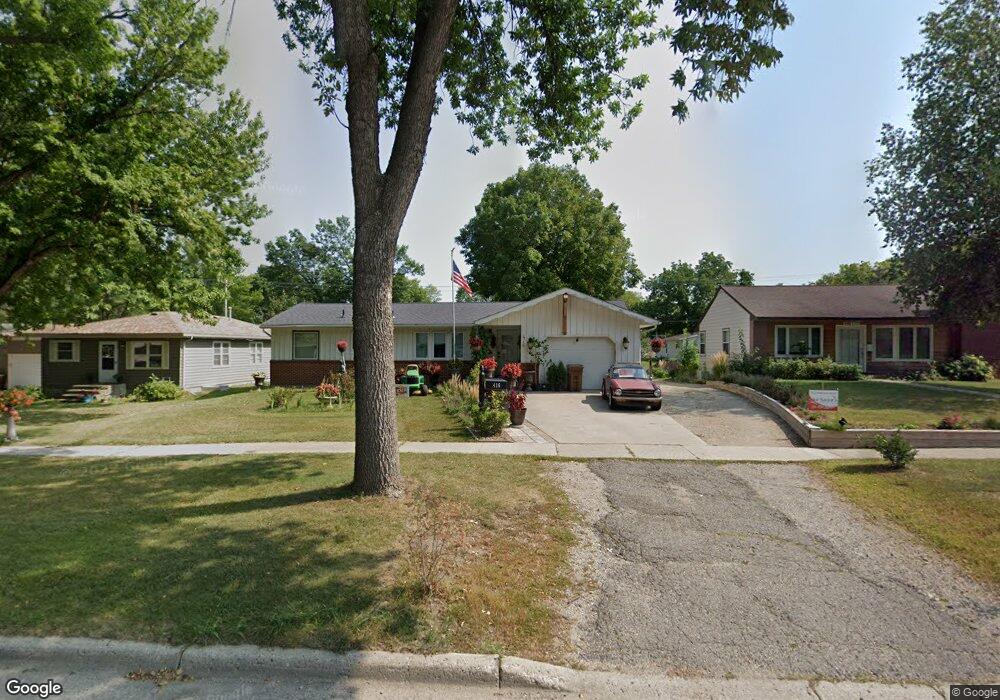
416 S 12th St Montevideo, MN 56265
Estimated Value: $175,000 - $209,000
2
Beds
2
Baths
1,700
Sq Ft
$112/Sq Ft
Est. Value
About This Home
This home is located at 416 S 12th St, Montevideo, MN 56265 and is currently estimated at $190,307, approximately $111 per square foot. 416 S 12th St is a home located in Chippewa County with nearby schools including Sanford Education Center, Ramsey Elementary School, and Montevideo Middle School.
Ownership History
Date
Name
Owned For
Owner Type
Purchase Details
Closed on
Aug 13, 2021
Sold by
Valentino Gabriel J and Valentino Eloise M
Bought by
Freeman Jackelyn and Curtiss Angela
Current Estimated Value
Purchase Details
Closed on
Jun 5, 2015
Sold by
Espinoza Rosa Rosa
Bought by
Valentino Gabriel Gabriel
Home Financials for this Owner
Home Financials are based on the most recent Mortgage that was taken out on this home.
Original Mortgage
$100,000
Interest Rate
0.78%
Mortgage Type
Purchase Money Mortgage
Purchase Details
Closed on
Oct 23, 2007
Sold by
Stelfox Victoria
Bought by
Espinoza Pedro O and Espinoza Rosa Maria
Purchase Details
Closed on
Nov 21, 2006
Sold by
Stegeman Vernice T
Bought by
Stelfox Victoria
Home Financials for this Owner
Home Financials are based on the most recent Mortgage that was taken out on this home.
Original Mortgage
$46,500
Interest Rate
6.36%
Create a Home Valuation Report for This Property
The Home Valuation Report is an in-depth analysis detailing your home's value as well as a comparison with similar homes in the area
Home Values in the Area
Average Home Value in this Area
Purchase History
| Date | Buyer | Sale Price | Title Company |
|---|---|---|---|
| Freeman Jackelyn | $3,000 | None Available | |
| Valentino Gabriel Gabriel | $70,000 | -- | |
| Espinoza Pedro O | $95,000 | None Available | |
| Stelfox Victoria | $149,245 | None Available |
Source: Public Records
Mortgage History
| Date | Status | Borrower | Loan Amount |
|---|---|---|---|
| Previous Owner | Valentino Gabriel Gabriel | $100,000 | |
| Previous Owner | Stelfox Victoria | $46,500 |
Source: Public Records
Tax History
| Year | Tax Paid | Tax Assessment Tax Assessment Total Assessment is a certain percentage of the fair market value that is determined by local assessors to be the total taxable value of land and additions on the property. | Land | Improvement |
|---|---|---|---|---|
| 2025 | $2,382 | $174,200 | $7,500 | $166,700 |
| 2024 | $2,448 | $171,800 | $7,500 | $164,300 |
| 2023 | $2,184 | $179,000 | $7,500 | $171,500 |
| 2022 | $1,828 | $149,400 | $7,500 | $141,900 |
| 2021 | $1,720 | $127,700 | $7,500 | $120,200 |
| 2020 | $1,452 | $110,900 | $6,600 | $104,300 |
| 2019 | $1,446 | $106,900 | $6,600 | $100,300 |
| 2018 | $882 | $78,518 | $0 | $0 |
| 2017 | $1,058 | $77,700 | $0 | $0 |
| 2016 | $1,556 | $61,700 | $0 | $0 |
| 2015 | -- | $93,900 | $0 | $0 |
| 2014 | -- | $91,400 | $0 | $0 |
| 2013 | -- | $91,400 | $0 | $0 |
Source: Public Records
Map
Nearby Homes