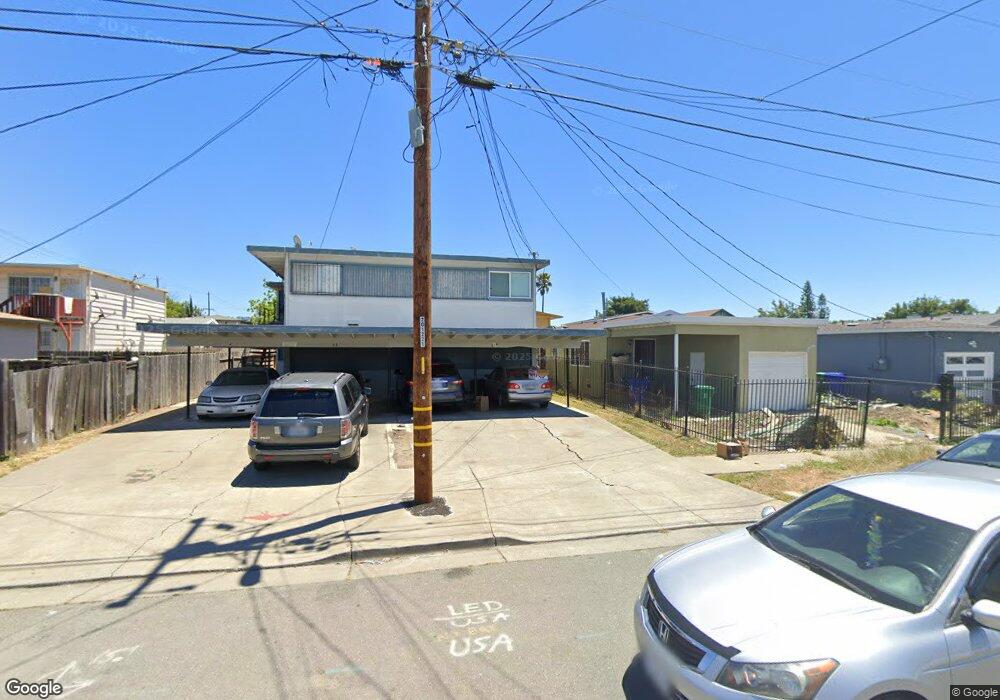
416 S 25th St Unit 422 Richmond, CA 94804
Cortez-Stege NeighborhoodEstimated Value: $587,000 - $721,000
--
Bed
--
Bath
3,158
Sq Ft
$202/Sq Ft
Est. Value
About This Home
This home is located at 416 S 25th St Unit 422, Richmond, CA 94804 and is currently estimated at $639,000, approximately $202 per square foot. 416 S 25th St Unit 422 is a home located in Contra Costa County with nearby schools including Coronado Elementary School, Lovonya DeJean Middle School, and John F. Kennedy High School.
Ownership History
Date
Name
Owned For
Owner Type
Purchase Details
Closed on
Mar 18, 2004
Sold by
Neals Veronica
Bought by
Neals Victor W
Current Estimated Value
Home Financials for this Owner
Home Financials are based on the most recent Mortgage that was taken out on this home.
Original Mortgage
$250,000
Outstanding Balance
$116,593
Interest Rate
5.64%
Mortgage Type
Stand Alone Refi Refinance Of Original Loan
Estimated Equity
$522,407
Purchase Details
Closed on
Oct 1, 1996
Sold by
Neals Jessie R
Bought by
Neals Jessie R and Neals Victor W
Create a Home Valuation Report for This Property
The Home Valuation Report is an in-depth analysis detailing your home's value as well as a comparison with similar homes in the area
Home Values in the Area
Average Home Value in this Area
Purchase History
| Date | Buyer | Sale Price | Title Company |
|---|---|---|---|
| Neals Victor W | -- | Fidelity National Title | |
| Neals Jessie R | -- | -- |
Source: Public Records
Mortgage History
| Date | Status | Borrower | Loan Amount |
|---|---|---|---|
| Open | Neals Victor W | $250,000 |
Source: Public Records
Tax History Compared to Growth
Tax History
| Year | Tax Paid | Tax Assessment Tax Assessment Total Assessment is a certain percentage of the fair market value that is determined by local assessors to be the total taxable value of land and additions on the property. | Land | Improvement |
|---|---|---|---|---|
| 2025 | $9,180 | $314,748 | $82,774 | $231,974 |
| 2024 | $8,844 | $308,577 | $81,151 | $227,426 |
| 2023 | $8,844 | $302,527 | $79,560 | $222,967 |
| 2022 | $8,561 | $296,596 | $78,000 | $218,596 |
| 2021 | $8,336 | $290,781 | $76,471 | $214,310 |
| 2019 | $7,773 | $282,157 | $74,203 | $207,954 |
| 2018 | $7,462 | $276,626 | $72,749 | $203,877 |
| 2017 | $7,225 | $271,203 | $71,323 | $199,880 |
| 2016 | $7,041 | $265,886 | $69,925 | $195,961 |
| 2015 | -- | $261,893 | $68,875 | $193,018 |
| 2014 | $6,807 | $256,764 | $67,526 | $189,238 |
Source: Public Records
Map
Nearby Homes