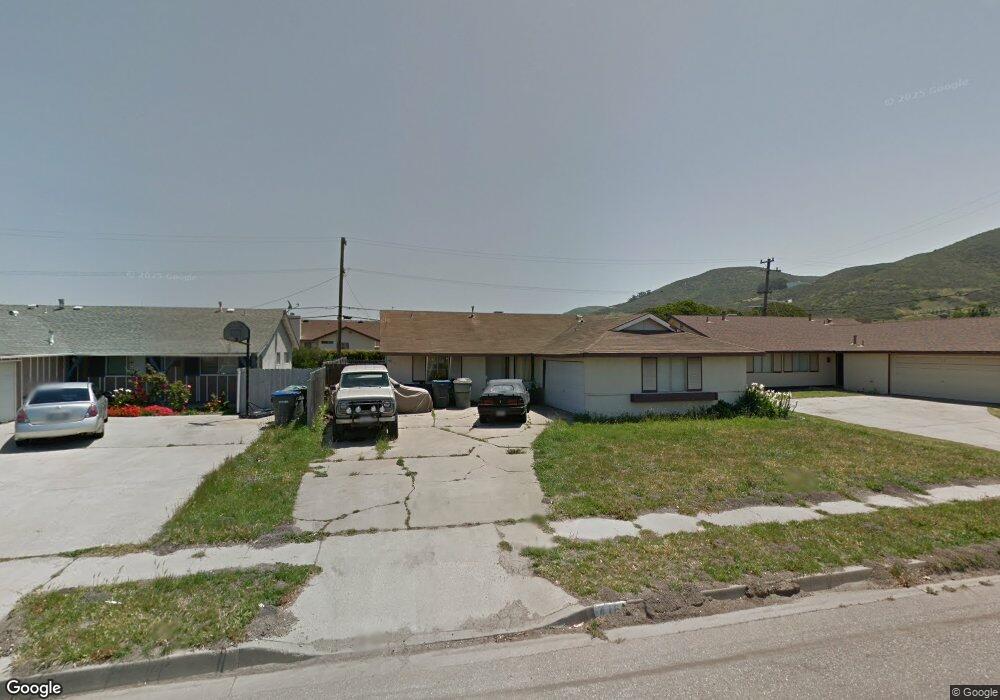
416 S T St Lompoc, CA 93436
Estimated Value: $429,000 - $489,000
3
Beds
2
Baths
1,052
Sq Ft
$438/Sq Ft
Est. Value
About This Home
This home is located at 416 S T St, Lompoc, CA 93436 and is currently estimated at $460,351, approximately $437 per square foot. 416 S T St is a home located in Santa Barbara County with nearby schools including Miguelito Elementary School, Lompoc Valley Middle School, and Lompoc High School.
Ownership History
Date
Name
Owned For
Owner Type
Purchase Details
Closed on
Jun 11, 2003
Sold by
Lamark Investment Co
Bought by
Fisher La Mott W
Current Estimated Value
Purchase Details
Closed on
Apr 2, 2003
Sold by
Fisher La Mott W
Bought by
La Mark Investment Company
Home Financials for this Owner
Home Financials are based on the most recent Mortgage that was taken out on this home.
Original Mortgage
$105,000
Interest Rate
4.75%
Mortgage Type
Negative Amortization
Purchase Details
Closed on
Mar 11, 1996
Sold by
La Mark Investment Company
Bought by
La Mark Investment Company
Home Financials for this Owner
Home Financials are based on the most recent Mortgage that was taken out on this home.
Original Mortgage
$77,000
Interest Rate
7.01%
Create a Home Valuation Report for This Property
The Home Valuation Report is an in-depth analysis detailing your home's value as well as a comparison with similar homes in the area
Home Values in the Area
Average Home Value in this Area
Purchase History
| Date | Buyer | Sale Price | Title Company |
|---|---|---|---|
| Fisher La Mott W | -- | -- | |
| La Mark Investment Company | -- | Landamerica Lawyers Title Co | |
| Fisher La Mott W | -- | Landamerica Lawyers Title Co | |
| La Mark Investment Company | -- | Chicago Title Co |
Source: Public Records
Mortgage History
| Date | Status | Borrower | Loan Amount |
|---|---|---|---|
| Previous Owner | Fisher La Mott W | $105,000 | |
| Previous Owner | La Mark Investment Company | $77,000 |
Source: Public Records
Tax History
| Year | Tax Paid | Tax Assessment Tax Assessment Total Assessment is a certain percentage of the fair market value that is determined by local assessors to be the total taxable value of land and additions on the property. | Land | Improvement |
|---|---|---|---|---|
| 2025 | $1,223 | $108,662 | $33,946 | $74,716 |
| 2023 | $1,223 | $104,444 | $32,629 | $71,815 |
| 2022 | $1,200 | $102,397 | $31,990 | $70,407 |
| 2021 | $1,212 | $100,390 | $31,363 | $69,027 |
| 2020 | $1,200 | $99,362 | $31,042 | $68,320 |
| 2019 | $1,179 | $97,415 | $30,434 | $66,981 |
| 2018 | $1,160 | $95,506 | $29,838 | $65,668 |
| 2017 | $1,139 | $93,634 | $29,253 | $64,381 |
| 2016 | $1,118 | $91,799 | $28,680 | $63,119 |
| 2014 | $1,094 | $88,651 | $27,697 | $60,954 |
Source: Public Records
Map
Nearby Homes
- 1220 W Lime Ave
- 1328 W Willow Ave
- 413 S O Place
- 1410 W Apricot Ave
- 60 Village Circle Dr
- 23 Village Circle Dr
- 1408 W Walnut Ave
- 112 N X St
- 524 Avalon St
- 267 Village Circle Dr
- 1011 W Walnut Ave
- 425 S J St
- 217 N M St
- 215 S H St
- 117 S I St
- 1355 Crown Cir
- 1445 Crown Cir
- 516 N U St
- 531 N O St
- 616 University Dr
Your Personal Tour Guide
Ask me questions while you tour the home.