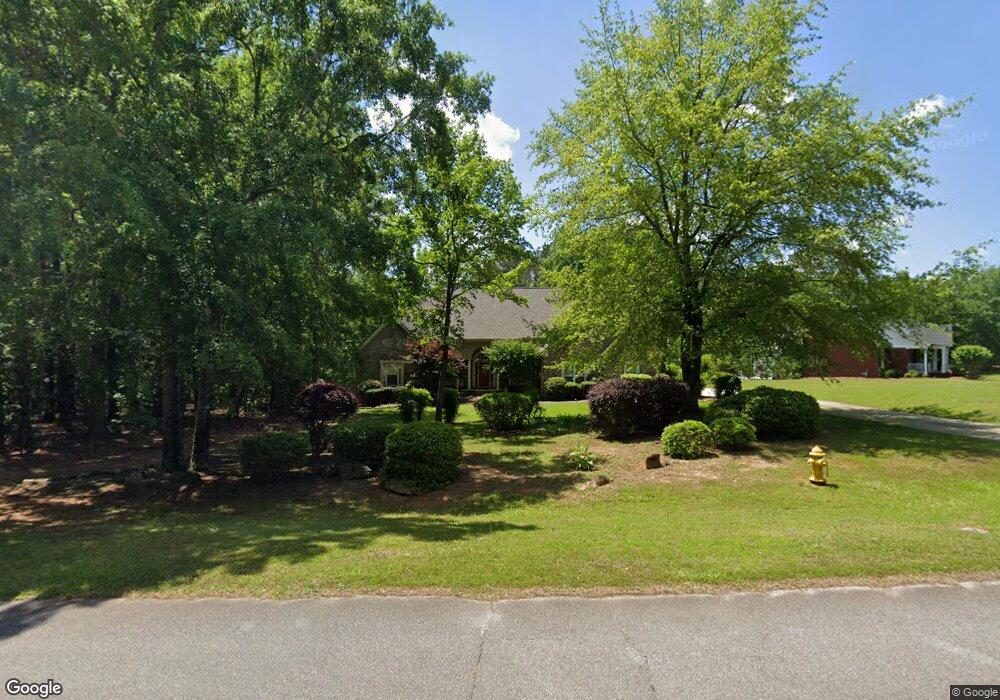
416 St Andrews Dr Jackson, GA 30233
Estimated Value: $452,000 - $520,000
3
Beds
3
Baths
2,760
Sq Ft
$176/Sq Ft
Est. Value
About This Home
This home is located at 416 St Andrews Dr, Jackson, GA 30233 and is currently estimated at $484,530, approximately $175 per square foot. 416 St Andrews Dr is a home located in Butts County with nearby schools including Jackson High School.
Ownership History
Date
Name
Owned For
Owner Type
Purchase Details
Closed on
Dec 10, 2019
Sold by
Amaral Geraldine A
Bought by
Lister Dorothy E
Current Estimated Value
Home Financials for this Owner
Home Financials are based on the most recent Mortgage that was taken out on this home.
Original Mortgage
$259,250
Outstanding Balance
$229,013
Interest Rate
3.7%
Mortgage Type
New Conventional
Estimated Equity
$255,517
Purchase Details
Closed on
May 31, 2006
Sold by
Not Provided
Bought by
Amaral Geraldine A and Amaral Michael E
Home Financials for this Owner
Home Financials are based on the most recent Mortgage that was taken out on this home.
Original Mortgage
$223,919
Interest Rate
6.51%
Mortgage Type
New Conventional
Purchase Details
Closed on
Jul 25, 2005
Sold by
Garland William J
Bought by
Mayfield Builders Llc
Home Financials for this Owner
Home Financials are based on the most recent Mortgage that was taken out on this home.
Original Mortgage
$202,500
Interest Rate
5.51%
Mortgage Type
New Conventional
Create a Home Valuation Report for This Property
The Home Valuation Report is an in-depth analysis detailing your home's value as well as a comparison with similar homes in the area
Home Values in the Area
Average Home Value in this Area
Purchase History
| Date | Buyer | Sale Price | Title Company |
|---|---|---|---|
| Lister Dorothy E | $305,000 | -- | |
| Amaral Geraldine A | $279,900 | -- | |
| Mayfield Builders Llc | $34,000 | -- |
Source: Public Records
Mortgage History
| Date | Status | Borrower | Loan Amount |
|---|---|---|---|
| Open | Lister Dorothy E | $259,250 | |
| Previous Owner | Amaral Geraldine A | $223,919 | |
| Previous Owner | Amaral Geraldine A | $27,991 | |
| Previous Owner | Mayfield Builders Llc | $202,500 |
Source: Public Records
Tax History Compared to Growth
Tax History
| Year | Tax Paid | Tax Assessment Tax Assessment Total Assessment is a certain percentage of the fair market value that is determined by local assessors to be the total taxable value of land and additions on the property. | Land | Improvement |
|---|---|---|---|---|
| 2024 | $4,616 | $196,088 | $15,960 | $180,128 |
| 2023 | $4,732 | $191,794 | $15,960 | $175,834 |
| 2022 | $4,222 | $155,616 | $12,000 | $143,616 |
| 2021 | $3,662 | $126,059 | $12,000 | $114,059 |
| 2020 | $3,677 | $121,866 | $12,000 | $109,866 |
| 2019 | $2,556 | $97,644 | $12,000 | $85,644 |
| 2018 | $2,439 | $90,386 | $12,000 | $78,386 |
| 2017 | $2,293 | $84,352 | $12,000 | $72,352 |
| 2016 | $2,303 | $82,752 | $10,400 | $72,352 |
| 2015 | $2,030 | $82,752 | $10,400 | $72,352 |
| 2014 | $1,915 | $71,450 | $10,400 | $61,050 |
Source: Public Records
Map
Nearby Homes
- 375 Saint Andrews Dr
- 0 Morningside Ct Unit 10557547
- 330 James Moore Cir
- 323 Maddox Cir
- 0 Macon Ave Unit 179549
- 0 Macon Ave Unit 10514173
- 1375 Highway 42 S
- 14 Weaver St
- 908 Nelson St
- 1065 Nelson St
- 965 Nelson St
- 143 Valley Hills Rd
- 119 Taylor Rd
- 591 Freeman St
- 1263 Highway 16 E
- 347 Ww Carr Ave
- 131 Taylor Rd
- 544 Franklin St
- 742 Joy St
- 144 Blake Ave
- 416 Saint Andrews Dr
- 366 Saint Andrews Dr
- 366 St Andrews Dr
- 298 Saint Andrews Dr
- 468 Saint Andrews Dr
- 160 Saint Andrews Ct
- 393 Saint Andrews Dr
- 465 Saint Andrews Dr Unit 12
- 465 Saint Andrews Dr
- 111 Thornbury Ct
- 121 St Andrews Ct
- 295 St Andrews Dr
- 333 Saint Andrews Dr
- 135 Thornbury Ct
- 295 Saint Andrews Dr
- 121 Saint Andrews Ct
- 465 Saint Anews Dr
- 485 Saint Andrews Dr
- 485 St Andrews Dr
- 355 Saint Andrews Dr