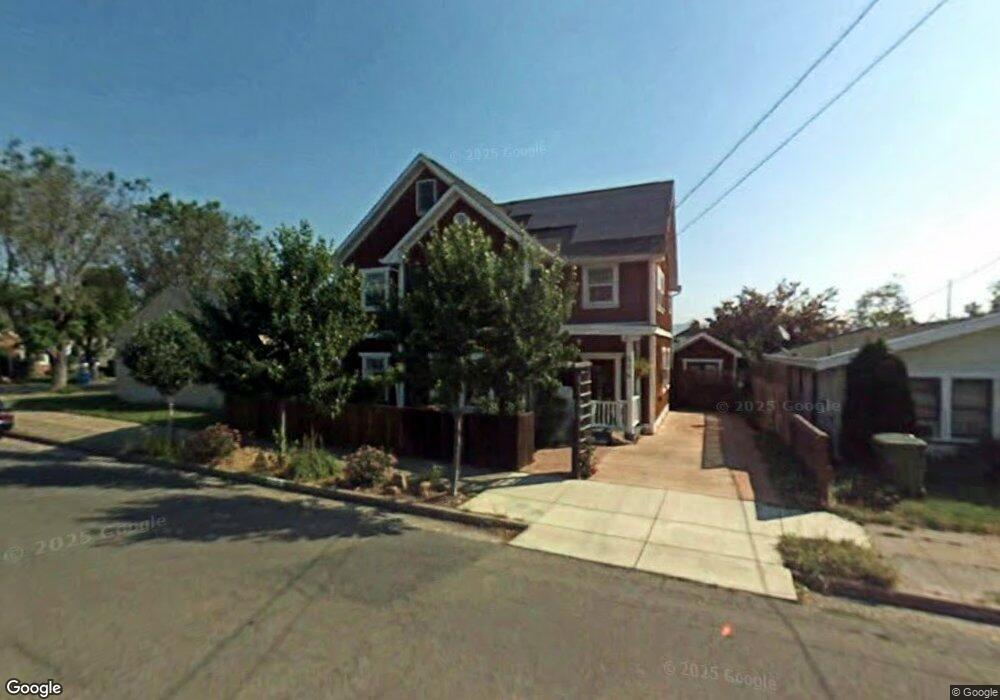
416 Webster St Petaluma, CA 94952
Western Petaluma NeighborhoodEstimated Value: $1,082,563 - $1,341,000
3
Beds
2
Baths
2,340
Sq Ft
$513/Sq Ft
Est. Value
About This Home
This home is located at 416 Webster St, Petaluma, CA 94952 and is currently estimated at $1,200,641, approximately $513 per square foot. 416 Webster St is a home located in Sonoma County with nearby schools including Valley Vista Elementary School, Petaluma Junior High School, and Petaluma High School.
Ownership History
Date
Name
Owned For
Owner Type
Purchase Details
Closed on
May 16, 2022
Sold by
Alden David A
Bought by
David A And Kathleen G Alden Revocable Trust
Current Estimated Value
Purchase Details
Closed on
Aug 16, 2005
Sold by
Alden David A and Alden David
Bought by
Alden David A and Alden Kathleen G
Purchase Details
Closed on
Jun 14, 2005
Sold by
Alden Kathleen
Bought by
Alden David
Home Financials for this Owner
Home Financials are based on the most recent Mortgage that was taken out on this home.
Original Mortgage
$608,800
Interest Rate
5.75%
Mortgage Type
New Conventional
Purchase Details
Closed on
May 18, 1998
Sold by
Anderson Charles B and Anderson Sondra
Bought by
Seely Stephan D and Seely Ann E
Home Financials for this Owner
Home Financials are based on the most recent Mortgage that was taken out on this home.
Original Mortgage
$145,000
Interest Rate
7.07%
Create a Home Valuation Report for This Property
The Home Valuation Report is an in-depth analysis detailing your home's value as well as a comparison with similar homes in the area
Home Values in the Area
Average Home Value in this Area
Purchase History
| Date | Buyer | Sale Price | Title Company |
|---|---|---|---|
| David A And Kathleen G Alden Revocable Trust | -- | None Listed On Document | |
| Alden David A | -- | Old Republic Title Co | |
| Alden David | -- | North American Title Co | |
| Alden David | $761,000 | North American Title Co | |
| Seely Stephan D | $153,000 | North Bay Title Co |
Source: Public Records
Mortgage History
| Date | Status | Borrower | Loan Amount |
|---|---|---|---|
| Previous Owner | Alden David | $608,800 | |
| Previous Owner | Alden David | $76,100 | |
| Previous Owner | Seely Stephan D | $145,000 |
Source: Public Records
Tax History
| Year | Tax Paid | Tax Assessment Tax Assessment Total Assessment is a certain percentage of the fair market value that is determined by local assessors to be the total taxable value of land and additions on the property. | Land | Improvement |
|---|---|---|---|---|
| 2025 | $11,286 | $1,059,361 | $696,950 | $362,411 |
| 2024 | $11,286 | $1,038,590 | $683,285 | $355,305 |
| 2023 | $11,286 | $1,018,227 | $669,888 | $348,339 |
| 2022 | $10,969 | $998,262 | $656,753 | $341,509 |
| 2021 | $10,760 | $978,689 | $643,876 | $334,813 |
| 2020 | $10,852 | $968,654 | $637,274 | $331,380 |
| 2019 | $10,716 | $949,662 | $624,779 | $324,883 |
| 2018 | $10,674 | $931,042 | $612,529 | $318,513 |
| 2017 | $10,448 | $912,787 | $600,519 | $312,268 |
| 2016 | $8,823 | $773,000 | $509,000 | $264,000 |
| 2015 | $8,264 | $723,000 | $476,000 | $247,000 |
| 2014 | $7,349 | $633,000 | $416,000 | $217,000 |
Source: Public Records
Map
Nearby Homes
Your Personal Tour Guide
Ask me questions while you tour the home.