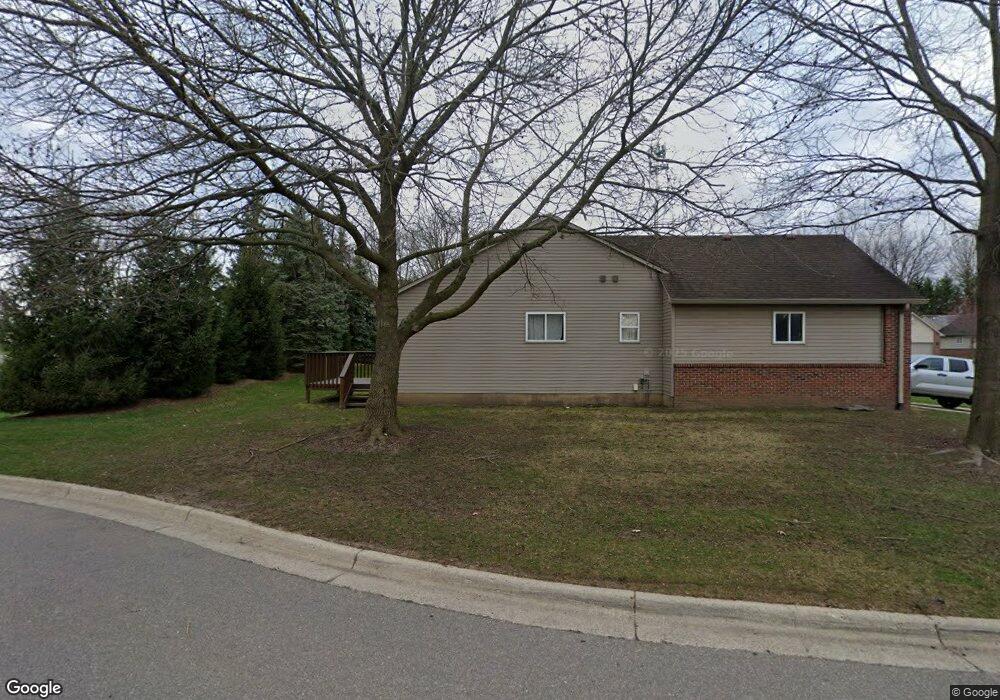
416 Woodfield Square Ln Unit 20, 78 Brighton, MI 48116
Estimated Value: $301,000 - $327,247
2
Beds
2
Baths
1,220
Sq Ft
$254/Sq Ft
Est. Value
About This Home
This home is located at 416 Woodfield Square Ln Unit 20, 78, Brighton, MI 48116 and is currently estimated at $310,062, approximately $254 per square foot. 416 Woodfield Square Ln Unit 20, 78 is a home located in Livingston County with nearby schools including Hilton Road Elementary School, Scranton Middle School, and Brighton High School.
Ownership History
Date
Name
Owned For
Owner Type
Purchase Details
Closed on
Aug 15, 2016
Sold by
Dornfeld Dona L and Dornfeld Clarence D
Bought by
Bellaver John
Current Estimated Value
Purchase Details
Closed on
Mar 28, 2016
Sold by
Bumpus Susan and Richards Kathleen
Bought by
Dornfield Calrence D and Dornfel Dona L
Home Financials for this Owner
Home Financials are based on the most recent Mortgage that was taken out on this home.
Original Mortgage
$159,900
Interest Rate
3.62%
Mortgage Type
VA
Purchase Details
Closed on
Aug 7, 2012
Sold by
Fannie Mae
Bought by
Bumpus Susan
Purchase Details
Closed on
Jan 6, 2012
Sold by
Bank Of America Na
Bought by
Fannie Mae
Purchase Details
Closed on
Dec 7, 2011
Sold by
Blyskal Diane F
Bought by
Bank Of America Na
Purchase Details
Closed on
May 12, 2010
Sold by
Mortgage Electronic Registration Syste
Bought by
Fannie Mae
Create a Home Valuation Report for This Property
The Home Valuation Report is an in-depth analysis detailing your home's value as well as a comparison with similar homes in the area
Home Values in the Area
Average Home Value in this Area
Purchase History
| Date | Buyer | Sale Price | Title Company |
|---|---|---|---|
| Bellaver John | $169,000 | None Available | |
| Dornfield Calrence D | $159,900 | None Available | |
| Bumpus Susan | $114,000 | -- | |
| Fannie Mae | -- | -- | |
| Bank Of America Na | $139,732 | -- | |
| Fannie Mae | -- | -- | |
| Mortgage Electronic Registration Syste | $124,258 | -- |
Source: Public Records
Mortgage History
| Date | Status | Borrower | Loan Amount |
|---|---|---|---|
| Previous Owner | Dornfield Calrence D | $159,900 |
Source: Public Records
Tax History Compared to Growth
Tax History
| Year | Tax Paid | Tax Assessment Tax Assessment Total Assessment is a certain percentage of the fair market value that is determined by local assessors to be the total taxable value of land and additions on the property. | Land | Improvement |
|---|---|---|---|---|
| 2025 | $5,045 | $157,600 | $0 | $0 |
| 2024 | $4,054 | $148,000 | $0 | $0 |
| 2023 | $3,859 | $132,900 | $0 | $0 |
| 2022 | $4,680 | $97,000 | $0 | $0 |
| 2021 | $4,678 | $106,800 | $0 | $0 |
| 2020 | $4,407 | $109,500 | $0 | $0 |
| 2019 | $4,404 | $97,000 | $0 | $0 |
| 2018 | $3,496 | $89,700 | $0 | $0 |
| 2017 | $3,576 | $91,600 | $0 | $0 |
| 2016 | $2,187 | $77,500 | $0 | $0 |
| 2014 | $2,994 | $62,380 | $0 | $0 |
| 2012 | $2,994 | $51,320 | $0 | $0 |
Source: Public Records
Map
Nearby Homes
- 392 Woodfield Square Ln
- 326 Redmaple Ln Unit 65
- 396 Spring Brooke Dr Unit 49
- 390 Spring Brooke Dr Unit 390
- 399 Spring Brooke Dr
- 413 Water Tower Cir Unit 97
- 171 Kissane Ave
- 9353 Old Lee Rd
- 6394 Stephen
- 1016 Pinewood Ct Unit 48
- 1025 Pinewood Ct Unit 30
- 0000 Grand River Ave
- 1242 Baywood Cir
- 840 Woodridge Hills Dr
- 1048 Pinewood Ct Unit 40
- 1041 Fairway Trails Dr
- 978 Oak Ridge Cir
- Lot 12 Wyndam Ln
- 1324 Peppergrove Dr
- 00 Cheddar Valley
- 416 Woodfield Square Ln Unit 78
- 416 Woodfield Square Ln
- 414 Woodfield Square Ln Unit 79
- 412 Woodfield Square Ln
- 201 Woodfield Square Ln Unit 116
- 204 Woodfield Square Ln
- 406 Woodfield Square Ln Unit 81
- 203 Woodfield Square Ln Unit 117
- 203 Woodfield Square Ln Unit 30 117
- 206 Woodfield Square Ln Unit 75
- 402 Woodfield Square Ln Unit 83
- 402 Woodfield Square Ln Unit 21 83
- 205 Woodfield Square Ln Unit Bldg-Unit
- 205 Woodfield Square Ln Unit 118
- 391 Woodfield Square Ln
- 400 Woodfield Square Ln
- 208 Woodfield Square Ln Unit 74
- 389 Woodfield Square Ln Unit 31 114
- 387 Woodfield Square Ln
- 394 Woodfield Square Ln Unit 85