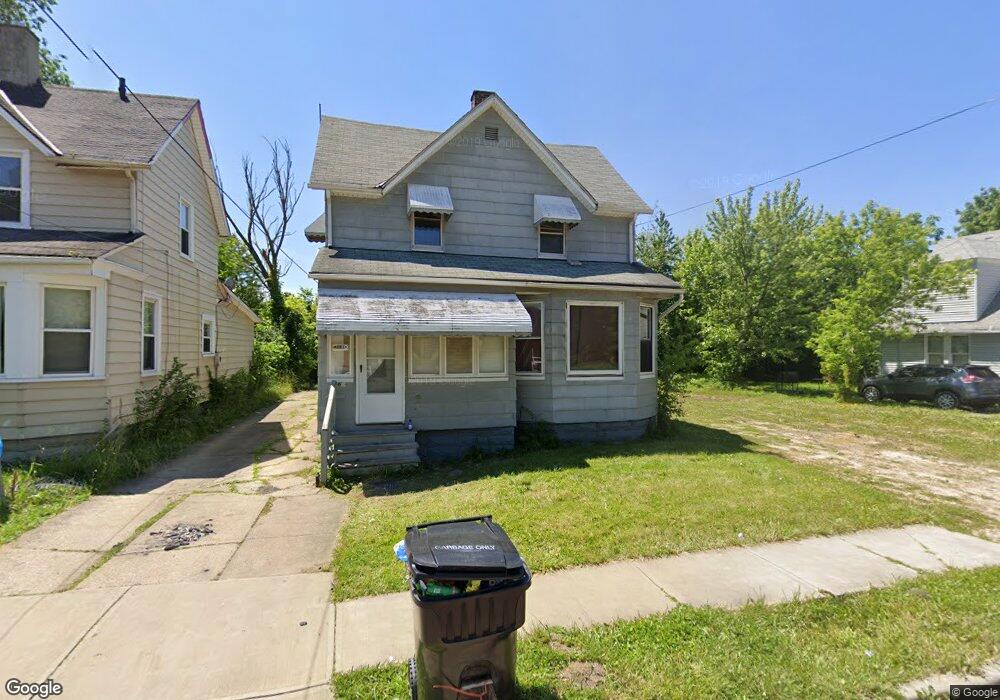
4160 E 102nd St Cleveland, OH 44105
Union-Miles Park NeighborhoodEstimated Value: $44,000 - $102,000
2
Beds
1
Bath
1,045
Sq Ft
$65/Sq Ft
Est. Value
About This Home
This home is located at 4160 E 102nd St, Cleveland, OH 44105 and is currently estimated at $67,572, approximately $64 per square foot. 4160 E 102nd St is a home located in Cuyahoga County with nearby schools including Andrew J. Rickoff School, Anton Grdina School, and Adlai Stevenson School.
Ownership History
Date
Name
Owned For
Owner Type
Purchase Details
Closed on
Sep 28, 2018
Sold by
Slattery Matthew
Bought by
Solid Blue Llc
Current Estimated Value
Purchase Details
Closed on
Apr 8, 2017
Sold by
Eniola David
Bought by
Salttery Matthew
Purchase Details
Closed on
Apr 3, 2015
Sold by
Jenisa Properties Llc
Bought by
Eniola David
Purchase Details
Closed on
Apr 8, 2011
Sold by
Tanner John Claude
Bought by
Jenisa Properties Llc
Purchase Details
Closed on
Dec 7, 2009
Sold by
Seshadri Satish and Seshadri Nisha
Bought by
Tanner John Claude
Purchase Details
Closed on
Sep 10, 2009
Sold by
Nj Finders Keepers Llc
Bought by
Seshadri Satish and Seshadri Nisha
Purchase Details
Closed on
May 27, 2009
Sold by
Deutsche Bank National Trust Company
Bought by
Nj Finders Keepers Llc
Purchase Details
Closed on
Sep 15, 2008
Sold by
Barnett Boykin and Barnett Lois
Bought by
Deutsche Bank National Trust Co
Purchase Details
Closed on
Jan 1, 1975
Bought by
Barnett Boykin and Barnett Lois
Create a Home Valuation Report for This Property
The Home Valuation Report is an in-depth analysis detailing your home's value as well as a comparison with similar homes in the area
Home Values in the Area
Average Home Value in this Area
Purchase History
| Date | Buyer | Sale Price | Title Company |
|---|---|---|---|
| Solid Blue Llc | -- | None Available | |
| Salttery Matthew | $9,000 | Progressive Land Title | |
| Eniola David | $9,000 | None Available | |
| Jenisa Properties Llc | -- | Ohio Real Title | |
| Tanner John Claude | $10,500 | Attorney | |
| Seshadri Satish | $5,000 | Attorney | |
| Nj Finders Keepers Llc | $2,750 | Cornerstone Title Svcs Llc | |
| Deutsche Bank National Trust Co | $8,000 | Attorney | |
| Barnett Boykin | -- | -- |
Source: Public Records
Tax History Compared to Growth
Tax History
| Year | Tax Paid | Tax Assessment Tax Assessment Total Assessment is a certain percentage of the fair market value that is determined by local assessors to be the total taxable value of land and additions on the property. | Land | Improvement |
|---|---|---|---|---|
| 2024 | $391 | $5,845 | $3,360 | $2,485 |
| 2023 | $294 | $3,790 | $1,790 | $2,000 |
| 2022 | $292 | $3,780 | $1,790 | $2,000 |
| 2021 | $289 | $3,780 | $1,790 | $2,000 |
| 2020 | $288 | $3,260 | $1,540 | $1,720 |
| 2019 | $267 | $9,300 | $4,400 | $4,900 |
| 2018 | $314 | $3,260 | $1,540 | $1,720 |
| 2017 | $364 | $4,310 | $1,190 | $3,120 |
| 2016 | $362 | $4,310 | $1,190 | $3,120 |
| 2015 | -- | $4,310 | $1,190 | $3,120 |
| 2014 | -- | $5,080 | $1,400 | $3,680 |
Source: Public Records
Map
Nearby Homes
- 4137 E 102nd St
- 4127 E 100th St
- 4139 E 97th St
- 9607 Pratt Ave
- 4154 E 95th St
- 4155 E 111th St
- 4119 E 111th St
- 4259 E 94th St
- 10225 Avon Ave
- 4221 E 112th St
- 10709 Avon Ave
- 10201 Dove Ave
- 9710 Nelson Ave
- 9706 Nelson Ave
- 10414 Nelson Ave
- 4112 E 114th St
- 9508 Nelson Ave
- 0 E 93rd St Unit 5030153
- 0 E 93rd St Unit 5030149
- 0 E 93rd St Unit 5030140
- 4158 E 102nd St
- 4152 E 102nd St
- 4148 E 102nd St
- 4161 E 102nd St
- 4163 E 102nd St
- 4145 E 100th St
- 4145 E 100th St Unit 1
- 4157 E 102nd St
- 4157 E 102nd St
- 4144 E 102nd St
- 4141 E 100th St
- 4147 E 102nd St
- 4142 E 102nd St
- 4152 E 100th St
- 4156 E 100th St
- 4143 E 102nd St
- 4160 E 100th St
- 4166 E 100th St
- 4139 E 100th St
- 4148 E 100th St