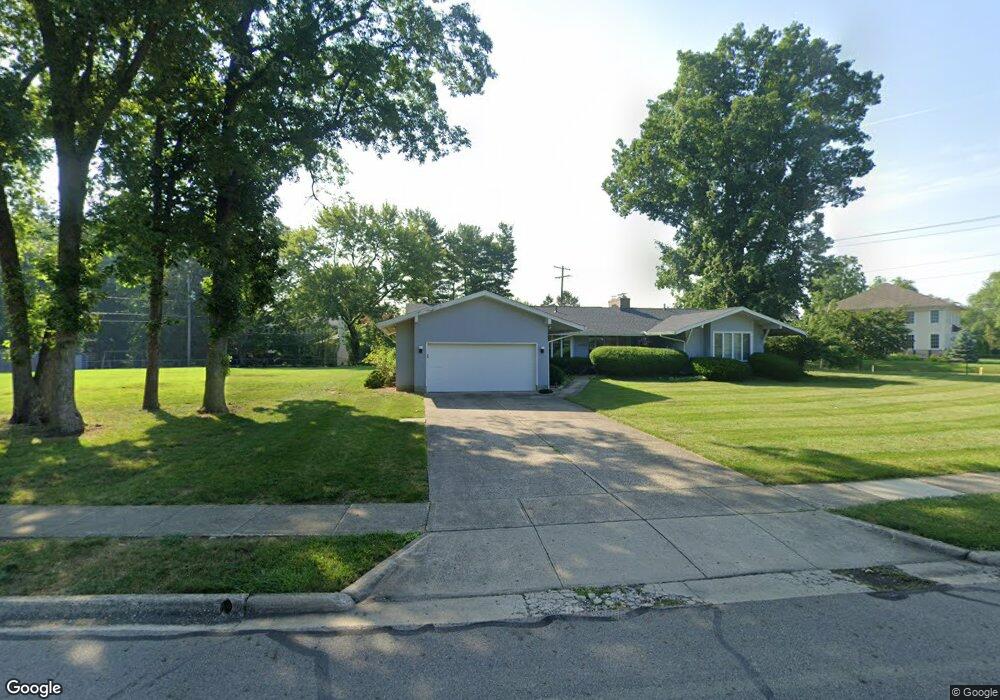
4160 Mountview Rd Columbus, OH 43220
Estimated Value: $728,269 - $832,000
4
Beds
4
Baths
2,703
Sq Ft
$289/Sq Ft
Est. Value
About This Home
This home is located at 4160 Mountview Rd, Columbus, OH 43220 and is currently estimated at $781,567, approximately $289 per square foot. 4160 Mountview Rd is a home located in Franklin County with nearby schools including Windermere Elementary School, Hastings Middle School, and Upper Arlington High School.
Ownership History
Date
Name
Owned For
Owner Type
Purchase Details
Closed on
Dec 16, 2016
Sold by
Headley Randall P and Headley Carol S
Bought by
Headley Randall P and Headley Carol S
Current Estimated Value
Purchase Details
Closed on
Oct 26, 1976
Bought by
Headley Randall P
Create a Home Valuation Report for This Property
The Home Valuation Report is an in-depth analysis detailing your home's value as well as a comparison with similar homes in the area
Home Values in the Area
Average Home Value in this Area
Purchase History
| Date | Buyer | Sale Price | Title Company |
|---|---|---|---|
| Headley Randall P | -- | None Available | |
| Headley Randall P | -- | -- |
Source: Public Records
Tax History
| Year | Tax Paid | Tax Assessment Tax Assessment Total Assessment is a certain percentage of the fair market value that is determined by local assessors to be the total taxable value of land and additions on the property. | Land | Improvement |
|---|---|---|---|---|
| 2025 | $10,504 | $191,240 | $85,750 | $105,490 |
| 2024 | $10,504 | $191,240 | $85,750 | $105,490 |
| 2023 | $10,410 | $191,240 | $85,750 | $105,490 |
| 2022 | $10,192 | $154,600 | $63,000 | $91,600 |
| 2021 | $9,022 | $154,600 | $63,000 | $91,600 |
| 2020 | $8,942 | $154,600 | $63,000 | $91,600 |
| 2019 | $8,381 | $129,610 | $63,000 | $66,610 |
| 2018 | $7,796 | $129,610 | $63,000 | $66,610 |
| 2017 | $8,317 | $129,610 | $63,000 | $66,610 |
| 2016 | $7,264 | $118,620 | $37,070 | $81,550 |
| 2015 | $7,258 | $118,620 | $37,070 | $81,550 |
| 2014 | $7,266 | $118,620 | $37,070 | $81,550 |
| 2013 | $3,442 | $107,835 | $33,705 | $74,130 |
Source: Public Records
Map
Nearby Homes
- 2200 Nayland Rd
- 2411 Sheringham Rd
- 4370 Harborough Rd
- 1605 Lafayette Dr Unit 1605
- 1594 Lafayette Dr Unit 1594
- 3670 Romnay Rd
- 2475 Mccoy Rd
- 2533 Middlesex Rd
- 3949 Norbrook Dr
- 1435 Havencrest Ct
- 2560 Chartwell Rd
- 2413 Edgevale Rd
- 2458 Edgevale Rd
- 2158 Sandston Rd
- 2626 Chartwell Rd
- 4803 Wynwood Ct
- 4305 Castleton Rd
- 2242 Atlee Ct Unit 5
- 2682 Lane Rd
- 1701 Moreland Dr
- 4170 Mountview Rd
- 1970 Mccoy Rd
- 1971 Mccoy Rd
- 4130 Mountview Rd
- 4146 Gavin Ln
- 1961 Mccoy Rd
- 1956 Mccoy Rd
- 4126 Mountview Rd
- 4145 Mountview Rd
- 4156 Gavin Ln
- 1951 Mccoy Rd
- 1944 Mccoy Rd
- 4105 Fenwick Rd
- 2027 Mccoy Rd
- 4112 Mountview Rd
- 4110 Fenwick Rd
- 4151 Gavin Ln
- 4121 Mountview Rd
- 4168 Gavin Ln
- 4125 Longhill Rd
Your Personal Tour Guide
Ask me questions while you tour the home.