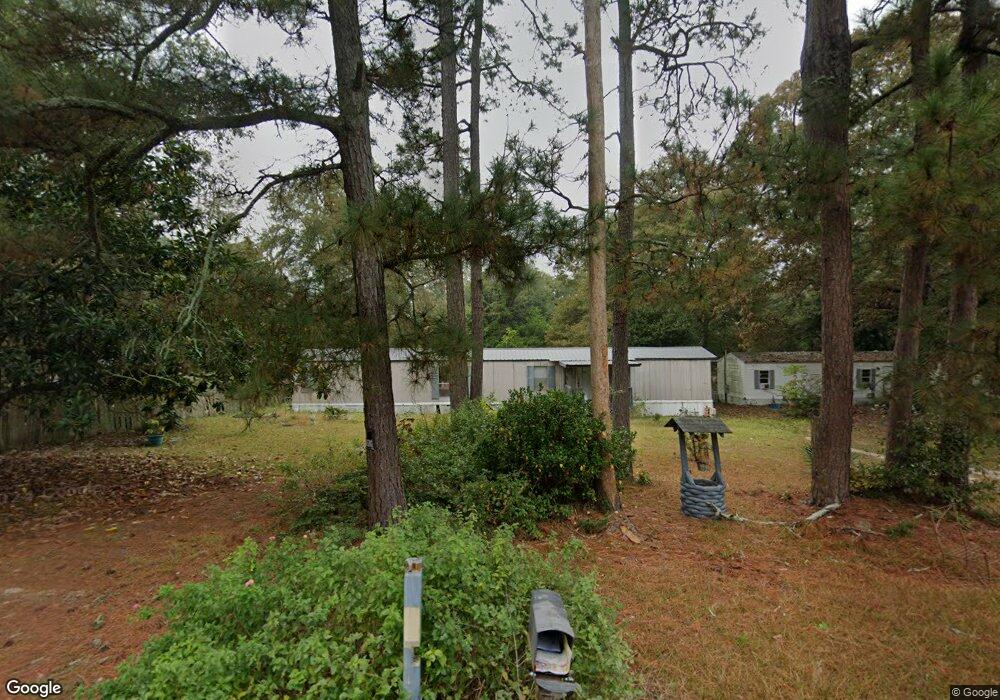
4161 Markwalter Rd Hephzibah, GA 30815
McDade NeighborhoodEstimated Value: $52,940 - $151,000
3
Beds
2
Baths
1,200
Sq Ft
$95/Sq Ft
Est. Value
About This Home
This home is located at 4161 Markwalter Rd, Hephzibah, GA 30815 and is currently estimated at $113,985, approximately $94 per square foot. 4161 Markwalter Rd is a home located in Richmond County with nearby schools including Goshen Elementary School, Pine Hill Middle School, and Johnson Magnet.
Ownership History
Date
Name
Owned For
Owner Type
Purchase Details
Closed on
Feb 8, 2024
Sold by
Smalley Jevone James
Bought by
Key James R
Current Estimated Value
Purchase Details
Closed on
Jul 12, 2010
Sold by
Lowery Timothy
Bought by
Smalley Jevone J
Purchase Details
Closed on
Jan 5, 2010
Sold by
Sellers Billy
Bought by
Regions Bk
Purchase Details
Closed on
Jun 7, 2005
Sold by
Price Patty and Oglesby Patty
Bought by
Sellers Billy
Home Financials for this Owner
Home Financials are based on the most recent Mortgage that was taken out on this home.
Original Mortgage
$24,401
Interest Rate
5.7%
Mortgage Type
Purchase Money Mortgage
Purchase Details
Closed on
Dec 1, 1995
Sold by
Fowler Eugene H
Bought by
Ray Holly Winters
Purchase Details
Closed on
May 1, 1987
Sold by
Moody Steven Scott
Bought by
Fowler Eugene H
Purchase Details
Closed on
Feb 1, 1984
Sold by
Higginson Virginia R
Bought by
Moody Steven Scott
Create a Home Valuation Report for This Property
The Home Valuation Report is an in-depth analysis detailing your home's value as well as a comparison with similar homes in the area
Home Values in the Area
Average Home Value in this Area
Purchase History
| Date | Buyer | Sale Price | Title Company |
|---|---|---|---|
| Key James R | $18,000 | -- | |
| Smalley Jevone J | $13,500 | -- | |
| Lowery Timothy | $11,000 | -- | |
| Regions Bk | $15,299 | -- | |
| Sellers Billy | $24,000 | -- | |
| Ray Holly Winters | $14,000 | -- | |
| Fowler Eugene H | $7,000 | -- | |
| Moody Steven Scott | $4,000 | -- |
Source: Public Records
Mortgage History
| Date | Status | Borrower | Loan Amount |
|---|---|---|---|
| Previous Owner | Sellers Billy | $24,401 |
Source: Public Records
Tax History Compared to Growth
Tax History
| Year | Tax Paid | Tax Assessment Tax Assessment Total Assessment is a certain percentage of the fair market value that is determined by local assessors to be the total taxable value of land and additions on the property. | Land | Improvement |
|---|---|---|---|---|
| 2025 | $721 | $9,340 | $3,800 | $5,540 |
| 2024 | $721 | $9,196 | $3,800 | $5,396 |
| 2023 | $518 | $9,060 | $3,800 | $5,260 |
| 2022 | $503 | $8,847 | $3,800 | $5,047 |
| 2021 | $494 | $8,220 | $3,800 | $4,420 |
| 2020 | $487 | $8,036 | $3,800 | $4,236 |
| 2019 | $495 | $8,075 | $3,800 | $4,275 |
| 2018 | $491 | $7,921 | $3,800 | $4,121 |
| 2017 | $461 | $7,813 | $3,800 | $4,013 |
| 2016 | $460 | $7,787 | $3,800 | $3,987 |
| 2015 | $464 | $7,898 | $3,800 | $4,098 |
| 2014 | $554 | $7,953 | $3,800 | $4,153 |
Source: Public Records
Map
Nearby Homes
- 4149 Markwalter Rd
- 4077 Burning Tree Ln
- 1663 Pine Ridge Dr N
- 1679 Pine Ridge Dr N
- 4065 Goshen Lake Dr S
- 1686 Pine Ridge Dr N
- 1898 McDade Farm Rd
- 1715 Pine Ridge Dr N
- 4051 Goshen Lake Dr S
- 4047 Goshen Lake Dr S
- 4053 Burning Tree Ln
- 1671 Pine Ridge Dr N
- 1724 Pine Ridge Dr N
- 1660 Pine Ridge Dr N
- 4331 Big Dipper Cir
- 4038 Goshen Lake Dr S
- 3405 Southern Ridge Ct
- 4036 Goshen Lake Dr S
- 4034 Burning Tree Ln
- 1683 Pine Ridge Dr N
- 4157 Mark Walter Rd
- 4163 Mark Walter Rd
- 4155 Mark Walter Rd
- 1705 Lawerence Rd
- 4152 Markwalter Rd
- 4152 Mark Walter Rd
- 4153 Mark Walter Rd
- 4148 Mark Walter Rd
- 4148 Markwalter Rd
- 4156 Mark Walter Rd
- 4165 Mark Walter Rd
- 1713 Lawerence Rd
- 4151 Markwalter Rd
- 4151 Mark Walter Rd
- 4165 Markwalter Rd
- 1709 Lawerence Rd
- 4160 Mark Walter Rd
- 4144 Mark Walter Rd
- 1706 Lawerence Rd
- 1711 Lawerence Rd