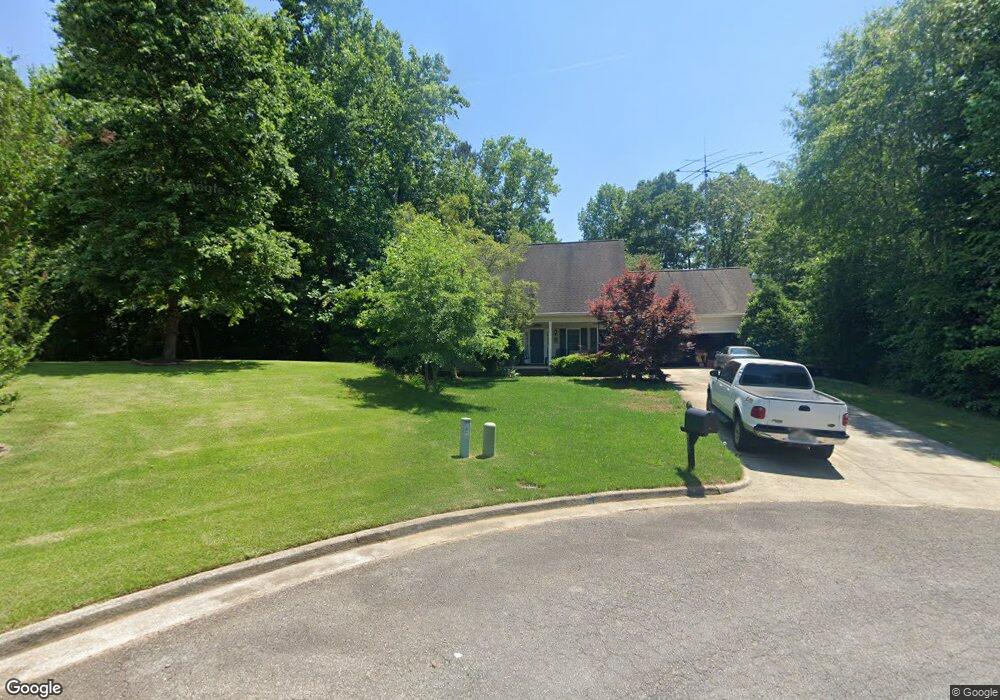
4161 Topsail Ridge Gainesville, GA 30506
Estimated Value: $396,872 - $475,000
3
Beds
3
Baths
2,380
Sq Ft
$188/Sq Ft
Est. Value
About This Home
This home is located at 4161 Topsail Ridge, Gainesville, GA 30506 and is currently estimated at $447,718, approximately $188 per square foot. 4161 Topsail Ridge is a home located in Hall County with nearby schools including Riverbend Elementary School, North Hall Middle School, and North Hall High School.
Ownership History
Date
Name
Owned For
Owner Type
Purchase Details
Closed on
Jan 9, 2012
Sold by
Foster Stanley R Co Truste
Bought by
Foster Stanley and Foster Betty
Current Estimated Value
Purchase Details
Closed on
Oct 5, 2005
Sold by
Foster Stanley Ron
Bought by
Foster Trust
Home Financials for this Owner
Home Financials are based on the most recent Mortgage that was taken out on this home.
Original Mortgage
$157,600
Interest Rate
5.71%
Mortgage Type
New Conventional
Purchase Details
Closed on
Mar 12, 1999
Sold by
Jls Constr Inc
Bought by
Marshall Stuart K and Marshall Deborah
Home Financials for this Owner
Home Financials are based on the most recent Mortgage that was taken out on this home.
Original Mortgage
$172,150
Interest Rate
6.74%
Mortgage Type
New Conventional
Purchase Details
Closed on
Jul 14, 1998
Sold by
Freeman Kenneth L
Bought by
J L S Construction Inc
Create a Home Valuation Report for This Property
The Home Valuation Report is an in-depth analysis detailing your home's value as well as a comparison with similar homes in the area
Home Values in the Area
Average Home Value in this Area
Purchase History
| Date | Buyer | Sale Price | Title Company |
|---|---|---|---|
| Foster Stanley | -- | -- | |
| Foster Trust | -- | -- | |
| Foster Stanley Ron | $197,000 | -- | |
| Marshall Stuart K | $177,500 | -- | |
| J L S Construction Inc | $36,000 | -- |
Source: Public Records
Mortgage History
| Date | Status | Borrower | Loan Amount |
|---|---|---|---|
| Previous Owner | Foster Stanley Ron | $157,600 | |
| Previous Owner | Marshall Stuart K | $172,150 |
Source: Public Records
Tax History Compared to Growth
Tax History
| Year | Tax Paid | Tax Assessment Tax Assessment Total Assessment is a certain percentage of the fair market value that is determined by local assessors to be the total taxable value of land and additions on the property. | Land | Improvement |
|---|---|---|---|---|
| 2024 | $1,283 | $147,320 | $30,200 | $117,120 |
| 2023 | $1,166 | $147,080 | $29,480 | $117,600 |
| 2022 | $1,070 | $111,760 | $17,720 | $94,040 |
| 2021 | $1,007 | $99,160 | $17,720 | $81,440 |
| 2020 | $958 | $95,520 | $17,720 | $77,800 |
| 2019 | $923 | $89,520 | $7,640 | $81,880 |
| 2018 | $791 | $74,000 | $6,360 | $67,640 |
| 2017 | $748 | $83,920 | $6,360 | $77,560 |
| 2016 | $1,740 | $63,296 | $5,800 | $57,496 |
| 2015 | $1,754 | $63,296 | $5,800 | $57,496 |
| 2014 | $1,754 | $63,296 | $5,800 | $57,496 |
Source: Public Records
Map
Nearby Homes
- 4160 Topsail Ridge
- 8320 Creekside Overlook
- 3610 Creekstone Dr
- 3614 Creekstone Dr
- 4022 Sutton Rd Unit 25
- 4368 Ed Henson Rd
- 4246 Jim Hood Rd
- 4542 Highland Gate Pkwy Unit 63
- 4542 Highland Gate Pkwy
- 3724 Clarks Bridge Rd
- 3847 Erwin Dr
- 3849 Mark Trail
- 4193 Cleveland Hwy Unit 26
- 4502 Highland Gate Pkwy Unit 73/74
- 4502 Highland Gate Pkwy
- 4449 Highland Gate Pkwy
- 3487 Big View Rd
- 4478 Highland Gate Pkwy Unit 78/79
- 4478 Highland Gate Pkwy
- 0 Lawson Cir Unit 10403965
- 4151 Topsail Ridge
- 4166 Topsail Ridge
- 4163 Topsail Ridge
- 4158 Topsail Ridge
- 4145 Topsail Ridge
- 4156 Topsail Ridge
- 4138 Catawba Ridge
- 4146 Topsail Ridge
- 4151 Catawba Ridge
- 4139 Catawba Ridge Unit 46
- 4139 Catawba Ridge
- 4142 Topsail Ridge
- 4132 Catawba Ridge
- 4135 Catawba Ridge
- 4143 Catawba Ridge
- 3895 Honeysuckle Rd
- 4131 Catawba Ridge
- 0 Catawba Ridge Unit 3253361
- 3817 N Rivercrest Dr
- 4112 Portland Trail