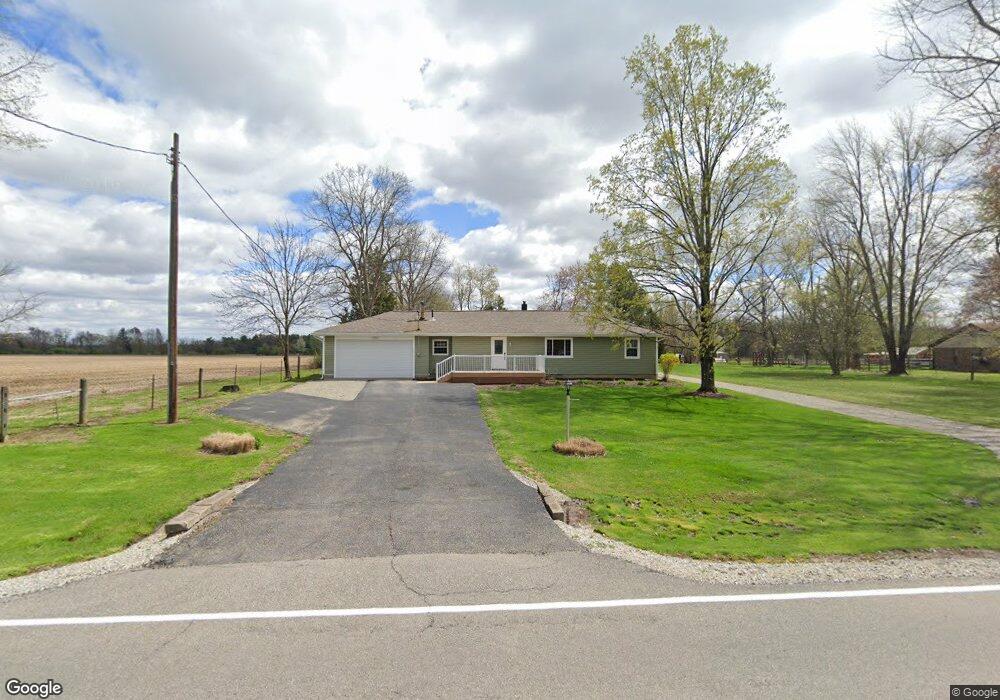
4163 E Foster Maineville Rd Morrow, OH 45152
Hamilton Township NeighborhoodEstimated Value: $248,000 - $321,000
3
Beds
1
Bath
1,070
Sq Ft
$261/Sq Ft
Est. Value
About This Home
This home is located at 4163 E Foster Maineville Rd, Morrow, OH 45152 and is currently estimated at $279,310, approximately $261 per square foot. 4163 E Foster Maineville Rd is a home located in Warren County with nearby schools including Little Miami Early Childhood Center, Little Miami Intermediate Middle School, and Little Miami Middle School.
Ownership History
Date
Name
Owned For
Owner Type
Purchase Details
Closed on
Dec 15, 2009
Sold by
Mace Walter L and Mace Linda D
Bought by
Campbell Emily F
Current Estimated Value
Home Financials for this Owner
Home Financials are based on the most recent Mortgage that was taken out on this home.
Original Mortgage
$112,200
Outstanding Balance
$73,633
Interest Rate
5.02%
Mortgage Type
New Conventional
Estimated Equity
$205,677
Purchase Details
Closed on
Nov 12, 2009
Sold by
Mace Walter L and Mace Linda D
Bought by
Goocey Albert David and Goocey Paul Arthur
Home Financials for this Owner
Home Financials are based on the most recent Mortgage that was taken out on this home.
Original Mortgage
$112,200
Outstanding Balance
$73,633
Interest Rate
5.02%
Mortgage Type
New Conventional
Estimated Equity
$205,677
Purchase Details
Closed on
Aug 28, 1992
Sold by
De Board & Clive Jr
Bought by
Jordan and Jordan Scott O
Purchase Details
Closed on
Jul 26, 1985
Sold by
De Board & Clive Jr & Mar
Bought by
De Board & Clive Jr.
Create a Home Valuation Report for This Property
The Home Valuation Report is an in-depth analysis detailing your home's value as well as a comparison with similar homes in the area
Home Values in the Area
Average Home Value in this Area
Purchase History
| Date | Buyer | Sale Price | Title Company |
|---|---|---|---|
| Campbell Emily F | $110,000 | Performance Title Services | |
| Goocey Albert David | $37,500 | Lawyers Title | |
| Jordan | $92,000 | -- | |
| De Board & Clive Jr. | -- | -- |
Source: Public Records
Mortgage History
| Date | Status | Borrower | Loan Amount |
|---|---|---|---|
| Open | Campbell Emily F | $112,200 |
Source: Public Records
Tax History Compared to Growth
Tax History
| Year | Tax Paid | Tax Assessment Tax Assessment Total Assessment is a certain percentage of the fair market value that is determined by local assessors to be the total taxable value of land and additions on the property. | Land | Improvement |
|---|---|---|---|---|
| 2024 | $2,850 | $63,040 | $14,450 | $48,590 |
| 2023 | $2,635 | $51,929 | $8,886 | $43,043 |
| 2022 | $2,609 | $51,930 | $8,887 | $43,043 |
| 2021 | $2,492 | $51,930 | $8,887 | $43,043 |
| 2020 | $2,381 | $42,217 | $7,224 | $34,993 |
| 2019 | $2,423 | $42,217 | $7,224 | $34,993 |
| 2018 | $2,463 | $42,217 | $7,224 | $34,993 |
| 2017 | $2,283 | $38,350 | $6,643 | $31,707 |
| 2016 | $2,330 | $38,350 | $6,643 | $31,707 |
| 2015 | $2,183 | $38,350 | $6,643 | $31,707 |
| 2014 | $1,757 | $27,800 | $6,040 | $21,770 |
| 2013 | $1,727 | $33,260 | $7,220 | $26,040 |
Source: Public Records
Map
Nearby Homes
- 4054 E Foster Maineville Rd
- 7194 Orchard View Ln
- 5750 Azra Ct
- 6017 Outlook Ct
- 7152 Gheils Carroll Rd
- 3797 E Foster-Maineville Rd
- Lot 3003 Morrow-Cozaddale Rd
- Lot 3001 Morrow-Cozaddale Rd
- 6401 Morrow Woodville Rd
- Lot A Ludlum Rd
- 2594 Ireland Rd
- 0 Morrow Cozaddale Rd Unit 1857301
- 5127 Allens Ridge Dr
- 4813 Allens Ridge Dr
- DaVinci Plan at Salt Run Preserve - Maple Street Collection
- Charles Plan at Salt Run Preserve - Designer Collection
- Yosemite Plan at Salt Run Preserve - Maple Street Collection
- Emmett Plan at Salt Run Preserve - Designer Collection
- Breckenridge Plan at Salt Run Preserve - Maple Street Collection
- Carrington Plan at Salt Run Preserve - Designer Collection
- 0 Debold Koebel Rd Unit 773298
- 0 Debold Koebel Rd Unit 738018
- 0 Debold Koebel Rd Unit 669342
- 0 Debold Koebel Rd Unit 612422
- 0 Debold Koebel Rd Unit 612420
- 0 Debold Koebel Rd Unit 572161
- 0 Debold Koebel Rd Unit 591204
- 0 Debold Koebel Rd Unit 554781
- 0 Debold Koebel Rd Unit 503986
- 0 Debold Koebel Rd Unit 523535
- 0 Debold Koebel Rd Unit 514506
- 0 Debold Koebel Rd Unit 518892
- 0 Debold Koebel Rd Unit 490782
- 0 Debold Koebel Rd Unit 484306
- 0 Debold Koebel Rd Unit 452887
- 0 Debold Koebel Rd Unit 468652
- 0 Debold Koebel Rd Unit 426547
- 0 Debold Koebel Rd Unit A 1646922
- 4131 E Foster Maineville Rd
- 4140 E Foster Maineville Rd