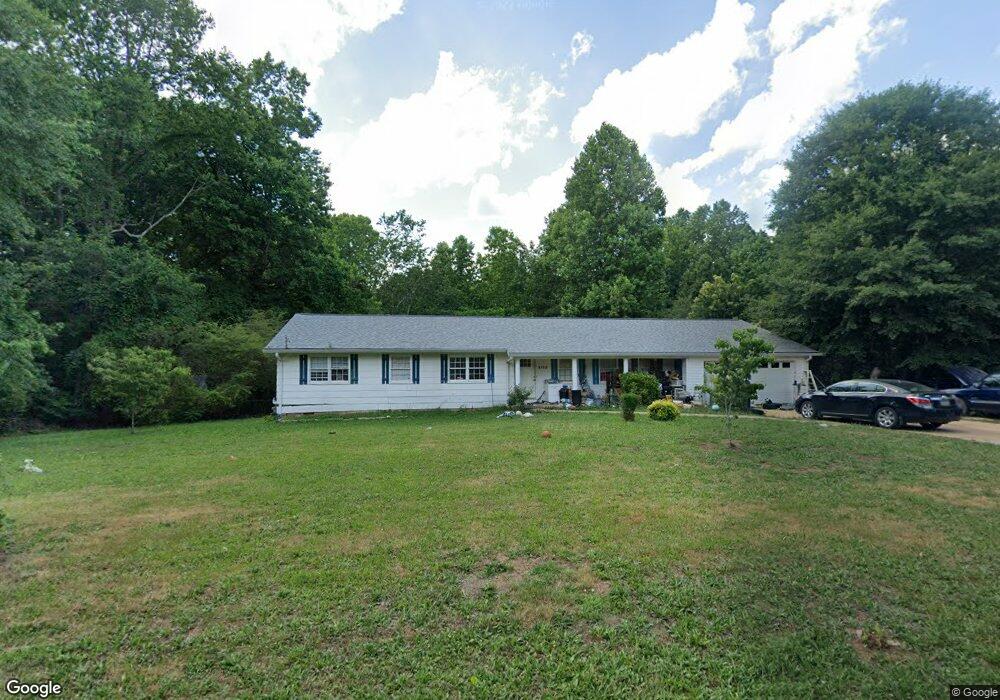
4169 Belvedere Dr Gainesville, GA 30506
Estimated Value: $309,000 - $363,000
4
Beds
4
Baths
2,048
Sq Ft
$164/Sq Ft
Est. Value
About This Home
This home is located at 4169 Belvedere Dr, Gainesville, GA 30506 and is currently estimated at $336,443, approximately $164 per square foot. 4169 Belvedere Dr is a home located in Hall County with nearby schools including Lanier Elementary School, Chestatee Middle School, and Chestatee High School.
Ownership History
Date
Name
Owned For
Owner Type
Purchase Details
Closed on
Mar 31, 2009
Sold by
Fannie Mae
Bought by
Wold Maria K
Current Estimated Value
Home Financials for this Owner
Home Financials are based on the most recent Mortgage that was taken out on this home.
Original Mortgage
$53,910
Outstanding Balance
$34,372
Interest Rate
5.1%
Mortgage Type
New Conventional
Estimated Equity
$302,072
Purchase Details
Closed on
Nov 5, 2008
Sold by
Countrywide Home Loans Inc
Bought by
Federal National Mortgage Association
Purchase Details
Closed on
Dec 23, 1999
Sold by
Lequire James Anthony
Bought by
Perez Yolanda
Home Financials for this Owner
Home Financials are based on the most recent Mortgage that was taken out on this home.
Original Mortgage
$89,900
Interest Rate
7.67%
Mortgage Type
New Conventional
Purchase Details
Closed on
Mar 25, 1996
Sold by
Sec Hud
Bought by
Lequire James Anthony
Create a Home Valuation Report for This Property
The Home Valuation Report is an in-depth analysis detailing your home's value as well as a comparison with similar homes in the area
Home Values in the Area
Average Home Value in this Area
Purchase History
| Date | Buyer | Sale Price | Title Company |
|---|---|---|---|
| Wold Maria K | -- | -- | |
| Federal National Mortgage Association | -- | -- | |
| Countrywide Home Loans Inc | $86,280 | -- | |
| Perez Yolanda | $89,900 | -- | |
| Lequire James Anthony | -- | -- |
Source: Public Records
Mortgage History
| Date | Status | Borrower | Loan Amount |
|---|---|---|---|
| Open | Wold Maria K | $53,910 | |
| Previous Owner | Perez Yolanda | $89,900 | |
| Closed | Lequire James Anthony | $0 |
Source: Public Records
Tax History Compared to Growth
Tax History
| Year | Tax Paid | Tax Assessment Tax Assessment Total Assessment is a certain percentage of the fair market value that is determined by local assessors to be the total taxable value of land and additions on the property. | Land | Improvement |
|---|---|---|---|---|
| 2024 | $2,323 | $93,040 | $18,320 | $74,720 |
| 2023 | $2,119 | $81,400 | $12,200 | $69,200 |
| 2022 | $1,674 | $64,080 | $7,640 | $56,440 |
| 2021 | $1,685 | $63,400 | $8,240 | $55,160 |
| 2020 | $1,552 | $56,720 | $6,960 | $49,760 |
| 2019 | $1,466 | $53,080 | $6,960 | $46,120 |
| 2018 | $1,695 | $59,560 | $14,880 | $44,680 |
| 2017 | $1,344 | $47,560 | $4,240 | $43,320 |
| 2016 | $1,238 | $44,800 | $3,560 | $41,240 |
| 2015 | $1,231 | $44,201 | $3,560 | $40,641 |
| 2014 | $1,231 | $44,201 | $3,560 | $40,641 |
Source: Public Records
Map
Nearby Homes
- 4202 Belvedere Dr
- 5565 Checkered Spot Dr
- 5445 Speckled Wood Ln
- 4114 Belvedere Dr
- 5342 Monarch Dr
- 4107 Belvedere Dr
- 3978 Pointe N
- 3938 Pointe N
- 4260 Mountain Ridge Rd
- 4006 Summit Chase
- 3916 Petes Dr
- 4785 Hiawatha Dr
- 4823 Hiawatha Dr
- 3804 Price Rd
- 3831 Brookburn Park
- 3903 Walnut Grove Way
- Cole Plan at Somerset at Riverbrook
- York Plan at Somerset at Riverbrook
- 4165 Belvedere Dr
- 4195 Belvedere Cir
- 4182 Belvedere Cir
- 4168 Belvedere Dr
- 4171 Belvedere Dr
- 4160 Belvedere Dr
- 4161 Belvedere Dr
- 4106 Judd Ct
- 4191 Belvedere Cir
- 0 Judd Ct Unit 3260795
- 0 Judd Ct Unit 8229720
- 0 Judd Ct Unit 8243186
- 0 Judd Ct
- 4172 Belvedere Dr
- 4179 Belvedere Cir
- 4157 Belvedere Dr
- 4176 Belvedere Dr
- 4110 Judd Ct
- 4107 Judd Ct
- 4111 Judd Ct