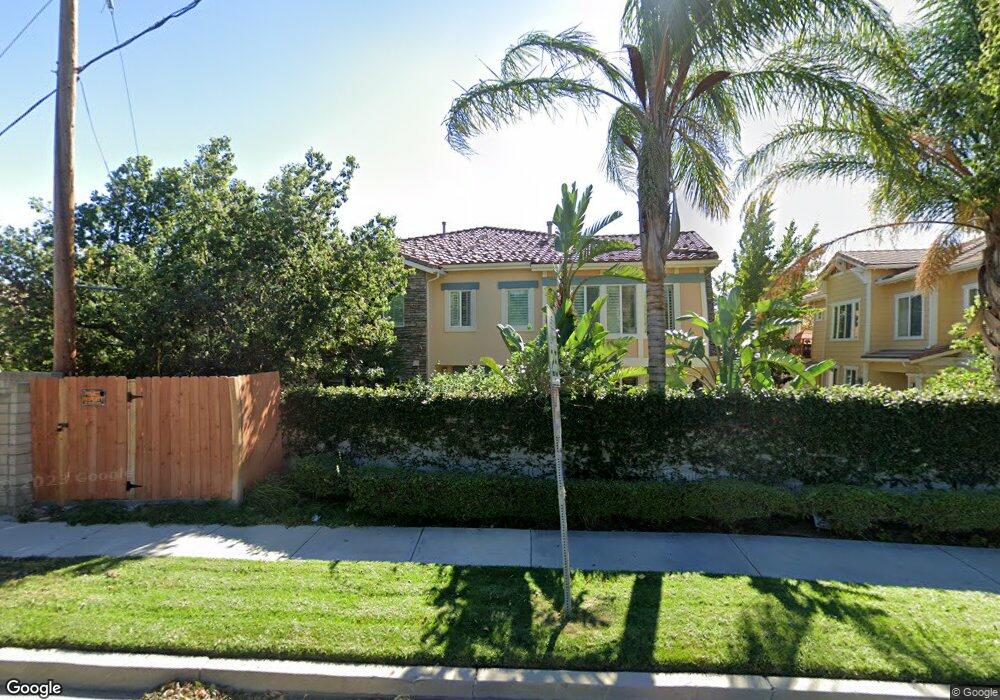
4169 Paredo Way Unit B Simi Valley, CA 93063
Central Simi Valley NeighborhoodEstimated Value: $709,000 - $744,000
3
Beds
2
Baths
1,640
Sq Ft
$441/Sq Ft
Est. Value
About This Home
This home is located at 4169 Paredo Way Unit B, Simi Valley, CA 93063 and is currently estimated at $723,671, approximately $441 per square foot. 4169 Paredo Way Unit B is a home located in Ventura County with nearby schools including Township Elementary School, Valley View Middle School, and Simi Valley High School.
Ownership History
Date
Name
Owned For
Owner Type
Purchase Details
Closed on
Sep 13, 2023
Sold by
Downs John
Bought by
Downs John and Lee Grace
Current Estimated Value
Purchase Details
Closed on
Aug 29, 2018
Sold by
Gutierrez Mary and The Gene D Vedder & Irene H Ve
Bought by
Downs John
Home Financials for this Owner
Home Financials are based on the most recent Mortgage that was taken out on this home.
Original Mortgage
$387,750
Interest Rate
4.5%
Mortgage Type
New Conventional
Purchase Details
Closed on
Nov 21, 2005
Sold by
Shea Homes Lp
Bought by
Vedder Gene D and Vedder Irene J
Home Financials for this Owner
Home Financials are based on the most recent Mortgage that was taken out on this home.
Original Mortgage
$125,000
Interest Rate
6.31%
Mortgage Type
Fannie Mae Freddie Mac
Create a Home Valuation Report for This Property
The Home Valuation Report is an in-depth analysis detailing your home's value as well as a comparison with similar homes in the area
Home Values in the Area
Average Home Value in this Area
Purchase History
| Date | Buyer | Sale Price | Title Company |
|---|---|---|---|
| Downs John | -- | None Listed On Document | |
| Downs John | $517,000 | Stewart Title Of California | |
| Vedder Gene D | $502,000 | Chicago Title Co 72 |
Source: Public Records
Mortgage History
| Date | Status | Borrower | Loan Amount |
|---|---|---|---|
| Previous Owner | Downs John | $387,750 | |
| Previous Owner | Vedder Gene D | $125,000 |
Source: Public Records
Tax History Compared to Growth
Tax History
| Year | Tax Paid | Tax Assessment Tax Assessment Total Assessment is a certain percentage of the fair market value that is determined by local assessors to be the total taxable value of land and additions on the property. | Land | Improvement |
|---|---|---|---|---|
| 2025 | $6,911 | $576,721 | $374,815 | $201,906 |
| 2024 | $6,911 | $565,413 | $367,465 | $197,948 |
| 2023 | $6,497 | $554,327 | $360,260 | $194,067 |
| 2022 | $6,477 | $543,458 | $353,196 | $190,262 |
| 2021 | $6,514 | $532,802 | $346,270 | $186,532 |
| 2020 | $6,384 | $527,340 | $342,720 | $184,620 |
| 2019 | $6,095 | $517,000 | $336,000 | $181,000 |
| 2018 | $1,911 | $129,228 | $46,446 | $82,782 |
| 2017 | $1,778 | $126,695 | $45,536 | $81,159 |
| 2016 | $1,690 | $124,212 | $44,644 | $79,568 |
| 2015 | $1,638 | $122,348 | $43,974 | $78,374 |
| 2014 | $1,596 | $119,953 | $43,113 | $76,840 |
Source: Public Records
Map
Nearby Homes
- 2987 Campa Way Unit D
- 3037 Divernon Ave
- 3024 Cicero Ct
- 3109 Arlington Ave
- 2918 Estilita Way Unit C
- 3276 Sunglow Ave
- 3194 Granville Ave
- 3954 Stell Dr
- 4508 Lubbock Dr Unit C
- 3265 Sheri Dr
- 4460 Lubbock Dr Unit B
- 4448 Lubbock Dr Unit C
- 4553 Alamo St Unit F
- 4421 Adam Rd
- 3791 Eucalyptus St
- 3941 Walnut Ave
- 3005 Mineral Wells Dr
- 4581 Lubbock Dr
- 3560 Monticello Ave
- 4169 Paredo Way
- 4169 Paredo Way Unit A
- 4169 Paredo Way Unit C
- 4168 Paredo Way Unit C
- 4168 Paredo Way Unit B
- 4168 Paredo Way Unit A
- 4153 Paredo Way Unit C
- 4153 Paredo Way Unit A
- 4153 Paredo Way Unit B
- 2998 Fuentes Ln Unit C
- 2998 Fuentes Ln Unit B
- 2998 Fuentes Ln Unit A
- 2992 Fuentes Ln
- 2992 Fuentes Ln Unit A
- 2992 Fuentes Ln Unit C
- 2992 Fuentes Ln Unit B
- 2986 Arbolitos Ln Unit C
- 2986 Arbolitos Ln Unit B
- 2986 Arbolitos Ln Unit A
- 4172 Avenida Simi