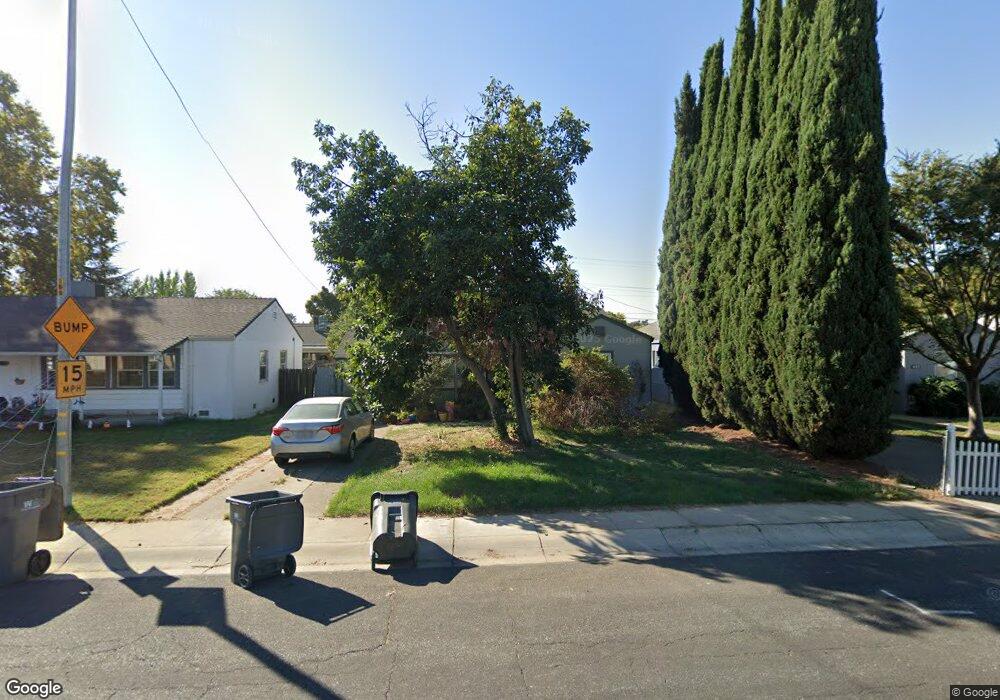
417 11th St West Sacramento, CA 95691
Old West Sacramento NeighborhoodEstimated Value: $275,000 - $439,000
2
Beds
1
Bath
1,110
Sq Ft
$336/Sq Ft
Est. Value
About This Home
This home is located at 417 11th St, West Sacramento, CA 95691 and is currently estimated at $373,326, approximately $336 per square foot. 417 11th St is a home located in Yolo County with nearby schools including Westmore Oaks Elementary School, River City High, and Sacramento Valley Charter School.
Ownership History
Date
Name
Owned For
Owner Type
Purchase Details
Closed on
Jul 26, 2011
Sold by
Federal National Mortgage Association
Bought by
Burris Anthony H
Current Estimated Value
Purchase Details
Closed on
May 9, 2011
Sold by
Rangel Kristy K
Bought by
Federal National Mortgage Association
Purchase Details
Closed on
Apr 25, 2007
Sold by
Wiedner Alberta R and Alberta R Wiedner Family Trust
Bought by
Rangel Kristy K
Home Financials for this Owner
Home Financials are based on the most recent Mortgage that was taken out on this home.
Original Mortgage
$280,000
Interest Rate
6.15%
Mortgage Type
Purchase Money Mortgage
Purchase Details
Closed on
Nov 27, 2001
Sold by
Wiedmer Alberta R
Bought by
Wiedner Alberta R and The Alberta R Wiedner Family T
Purchase Details
Closed on
Jul 13, 1994
Sold by
Buchanan Michael F and Buchanan Janelle J
Bought by
Wiedner Alberta R
Home Financials for this Owner
Home Financials are based on the most recent Mortgage that was taken out on this home.
Original Mortgage
$75,000
Interest Rate
3.95%
Create a Home Valuation Report for This Property
The Home Valuation Report is an in-depth analysis detailing your home's value as well as a comparison with similar homes in the area
Home Values in the Area
Average Home Value in this Area
Purchase History
| Date | Buyer | Sale Price | Title Company |
|---|---|---|---|
| Burris Anthony H | $119,000 | Stewart Title Of California | |
| Federal National Mortgage Association | $238,973 | Accommodation | |
| Rangel Kristy K | $280,000 | Old Republic Title Company | |
| Wiedner Alberta R | -- | -- | |
| Wiedner Alberta R | $95,000 | North American Title Company |
Source: Public Records
Mortgage History
| Date | Status | Borrower | Loan Amount |
|---|---|---|---|
| Previous Owner | Rangel Kristy K | $280,000 | |
| Previous Owner | Wiedner Alberta R | $75,000 |
Source: Public Records
Tax History Compared to Growth
Tax History
| Year | Tax Paid | Tax Assessment Tax Assessment Total Assessment is a certain percentage of the fair market value that is determined by local assessors to be the total taxable value of land and additions on the property. | Land | Improvement |
|---|---|---|---|---|
| 2025 | $1,871 | $149,458 | $50,235 | $99,223 |
| 2023 | $1,871 | $143,656 | $48,285 | $95,371 |
| 2022 | $1,747 | $140,840 | $47,339 | $93,501 |
| 2021 | $1,732 | $138,079 | $46,411 | $91,668 |
| 2020 | $1,652 | $136,665 | $45,936 | $90,729 |
| 2019 | $1,633 | $133,986 | $45,036 | $88,950 |
| 2018 | $1,602 | $131,359 | $44,153 | $87,206 |
| 2017 | $1,586 | $128,785 | $43,288 | $85,497 |
| 2016 | $1,563 | $126,261 | $42,440 | $83,821 |
| 2015 | $1,502 | $124,365 | $41,803 | $82,562 |
| 2014 | $1,429 | $121,930 | $40,985 | $80,945 |
Source: Public Records
Map
Nearby Homes
- 1043 Park Blvd
- 1549 Virginia Ave
- 1908 Proctor Ave
- 1021 Sycamore Ave
- 1712 Ferndale Cir
- 785 Dolomite Ct
- 1925 Willow Ave
- 839 Copper Ln
- 1003 Central St
- 788 Pearlite Ct
- 839 Graphite Ln
- 1911 Vermont Ave
- 1826 Maryland Ave
- 853 Bainite Ct
- 792 Alloy Ct
- 845 Zinc Ct
- 1916 Park Blvd
- 2000 W Capitol Ave Unit 125
- 1832 Rockrose Rd
- 1050 W Capitol Ave Unit 10